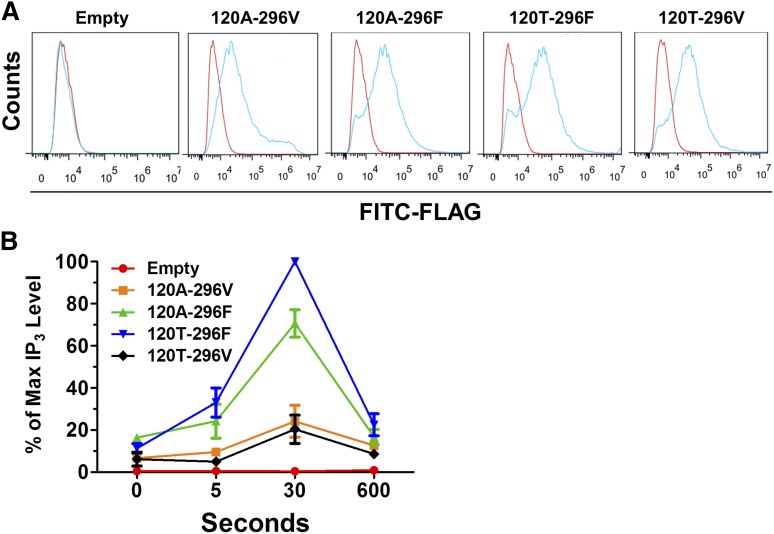
Figure 4.
Functional differences in IP3 generation. (A) Representative flow cytometry tracings for surface FLAG-PAR4 expression. 120A-296V indicates the expression construct for PAR4-Ala120-Val296, 120A-296F for PAR4-Ala120-Phe296, 120T-296F for PAR4-Thr120-Phe296, and 120T-296V for PAR4-Thr120-Val296. Blue, α-FLAG; red, IgG control. (B) IP3 generation in 293 cells transfected with FLAG-PAR4 variants or control stimulated with 1 mM PAR4-AP. IP3 levels were normalized to cell number and PAR4 surface expression. For each independent experiment, all data points were calculated relative to the IP3 quantified in the PAR4-Thr120-Phe296 expressing cells after 30 seconds of treatment (ie, the maximum value measured in all experiments [percentage of maximum IP3 level]). n = 3. P value for 120T-296F vs 120A-296F at 30s = 0.01, 2-tailed t test.

