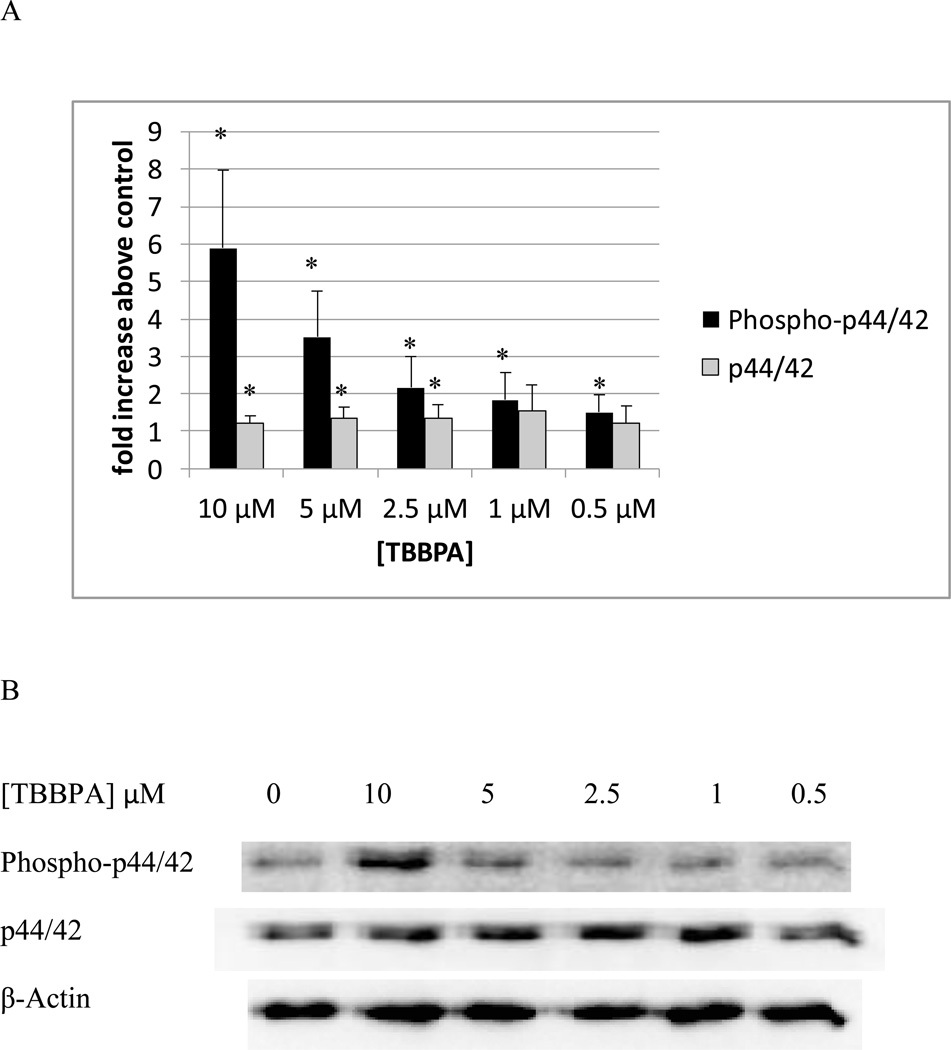
Figure 1. Effects of 10 minute exposures to 10- 0.5 µM TBBPA on phospho-p44/42 and total p44/42 in NK cells.
A) levels of phospho-p44/42 and total p44/42 normalized to control in pure NK. Values are mean ± S.D. from 8 separate experiments using cells from 8 different donors. * indicates significant difference compared to the control (p<0.05). The density of each protein band was normalized to β-actin to correct for small differences in protein loading among the lanes. B) Blot from a representative experiment.

