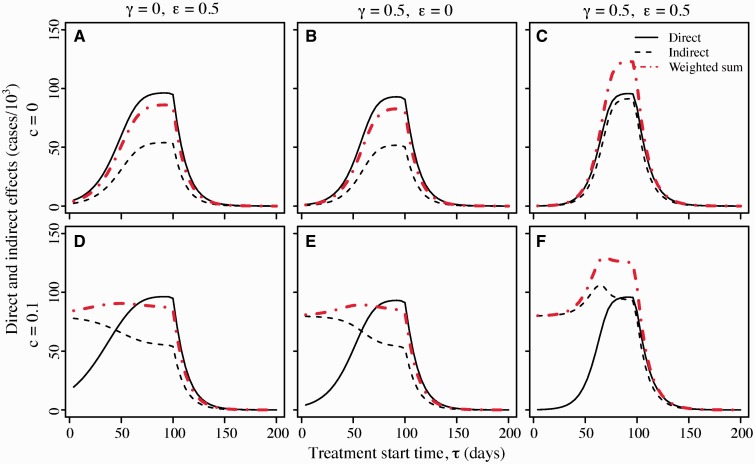
Figure 3.
Effects of antimicrobial therapy as a function of the time at which treatment is deployed. Direct effects (solid line) are measured in thousands of cases treated successfully, i.e. by treatment of individuals infected with drug-sensitive strains. Indirect effects (dashed line) reflect the change in the epidemic trajectory due to antimicrobial use: the indirect effects of treatment are quantified by the decrease in the number of cases in thousands when treatment is used relative to the number that would have occurred in the absence of treatment. The weighted sum of effects (indirect effects + 0.33*direct effects) is shown with red dot-dashed lines. In the top panels (A–C) the cost of resistance c is zero; in the bottom panels (D–F) cost c = 0.1. A and D: treatment reduces duration of infection () but not transmissibility (γ = 0). B and E: treatment reduces transmissibility () but not duration (ϵ = 0). C and F: treatment reduces duration () and transmissibility (). Unless indicated otherwise, the other parameters are as given in Table 1 with stockpile size

