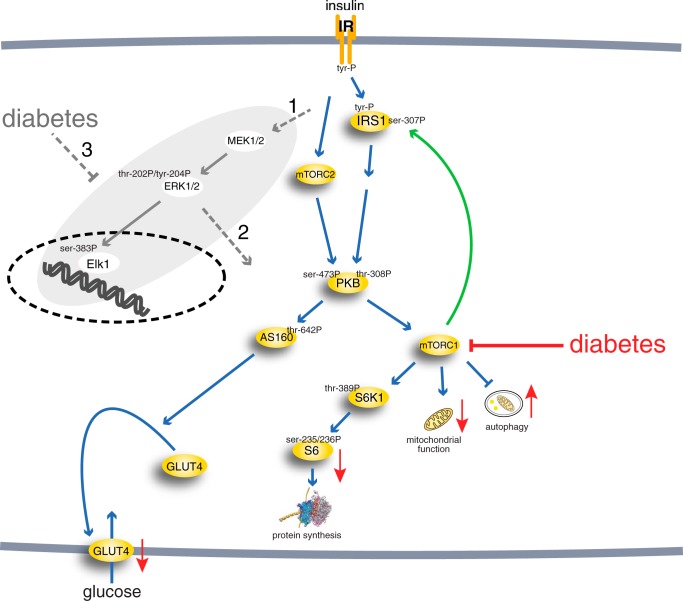
FIGURE 1.
The insulin signaling network. Examined phosphorylation sites in signaling intermediaries are indicated (-P). mTORC2, mammalian target of rapamycin in complex with rictor and Elk1 (ETS domain-containing protein). The green arrow indicates positive feedback signal. Red arrows indicate functional effects of insulin-resistant insulin signaling in T2D. The gray area indicates the focus of this investigation, with dashed gray arrows indicating outstanding questions answered herein: whether the MAPK pathway is controlled via IRS1, another adapter protein or both (1); whether ERK1/2 signaling cross-talks with the other branches of the insulin signaling network (2); and to what extent ERK1/2 signaling is affected in T2D and whether the same mechanisms are involved as in the rest of the signaling network (3).

