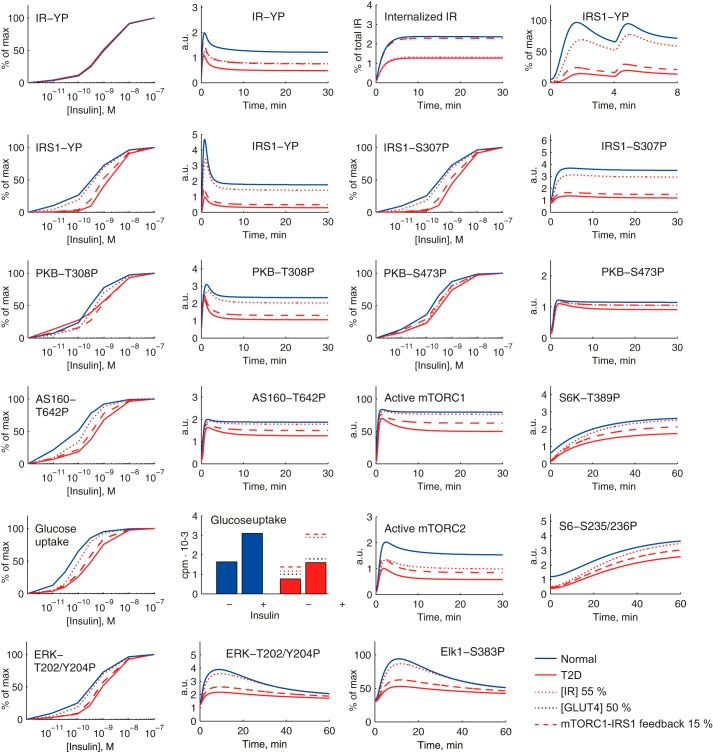
FIGURE 10.
Simulating individual effects of the three diabetes parameters in the comprehensive dynamic insulin signaling model. Shown are model simulations of insulin signaling normally (blue solid lines) and in T2D (red solid lines) for indicated signaling intermediaries. The effect of reducing the IR concentration to 55% of normal is a slight reduction of the activation of most signaling intermediaries (red dotted lines). Reducing the GLUT4 concentration by 50% influences solely the total level of glucose uptake (black dotted lines, shown only in the graph of total glucose uptake). The main contribution to the T2D state is the reduction of the mTORC1-IRS1 feedback to 15% (red dashed lines) of normal, which affects both maximal activation and insulin sensitivity for all signaling intermediaries that are affected in the T2D state. a.u., arbitrary units.

