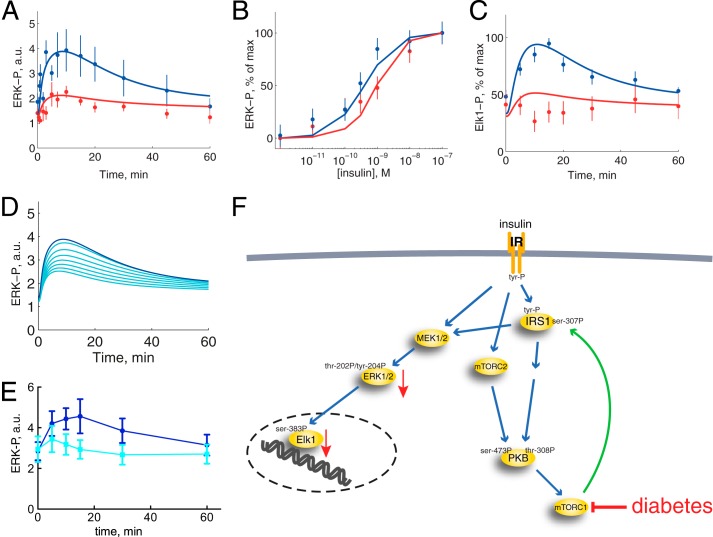
FIGURE 6.
Comparison of model simulations with experimental data for ERK1/2 and Elk1 phosphorylation in the non-diabetic and T2D states. Shown are model simulations (lines) and experimental data (dots with error bars (S.E.); from Fig. 1) for the non-diabetic state (blue) and in T2D (red). A, time course of ERK1/2-Thr202/Tyr204-P in response to 10 nm insulin for the indicated times, scaled with a normalization constant for best fit with experimental data normally. B, dose response of ERK1/2-Thr202/Tyr204-P in response to the indicated concentrations of insulin for 10 min and normalized 0–100%. C, time course of Elk1-Ser383-P in response to 10 nm insulin for the indicated times, scaled with a normalization constant for best fit with experimental data normally. D, simulations of model variable ERK1/2-Thr202/Tyr204-P (blue) when the effect of mTORC1 inhibitor rapamycin is implemented as reduced mTORC1 activation by 50, 75, 83, 88, 90, 92, and 93% (cyan). E, effect of 50 nm rapamycin (cells preincubated 30 min) on the time course for phosphorylation of ERK1/2-Thr202/Tyr204 in response to 10 nm insulin for the indicated times. Adipocytes from five non-diabetic control subjects (age 51–66, average 60 years; BMI 18–27, average 24 kg/m2) were analyzed. F, insulin signaling for control of ERK1/2 and Elk1 phosphorylation, normally and in T2D. For more details, see the legend to Fig. 1. a.u., arbitrary units.

