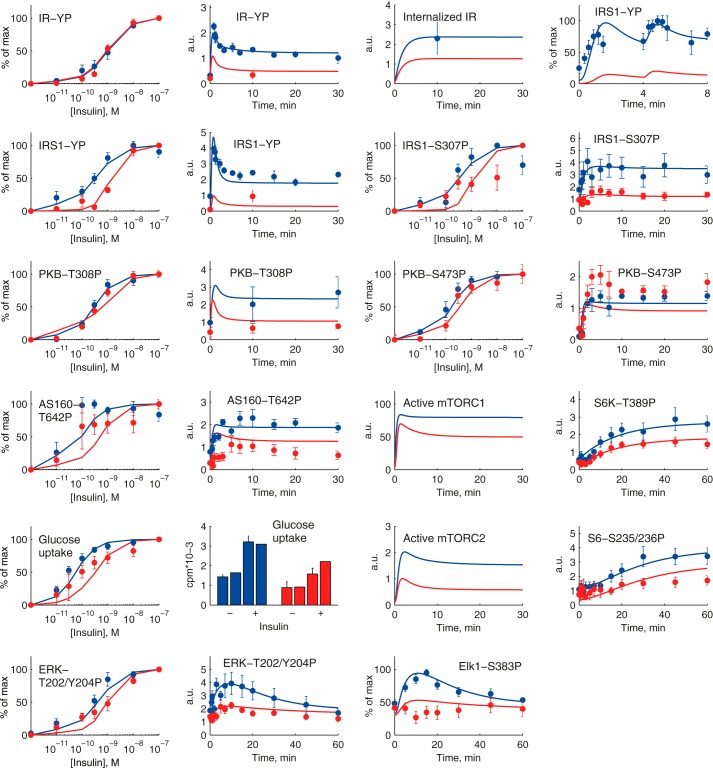
FIGURE 9.
A comprehensive dynamic model of insulin signaling. Shown are model simulations (lines) for insulin signaling normally (blue) and in T2D (red) and comparison with the corresponding experimental data (dots and error bars (S.E.)) for the indicated signaling intermediaries. The experimental data are explained in the legend to Fig. 2 and in Ref. 3. T2D is simulated with the three diabetes parameters: 45% reduced concentration of IR, 50% reduced concentration of GLUT4, and 85% reduced mTORC1-to-IRS1 feedback. a.u., arbitrary units.

