
FIGURE 5.
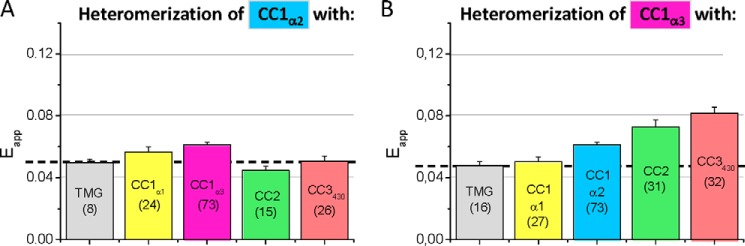
Heteromeric interactions of the respective α2 and α3 helix of the CC1 domain with various OASF domains. FRET (Eapp) determined from heteromeric interactions of (A) CC1 α2 and (B)CC1 α3 with various domains of OASF as depicted in Fig. 4. Interaction with TMG (no OASF fragment linked) represents control, with the dashed lines in A and B representing the magnitude of the background signal. Number of cells studied are given in brackets.