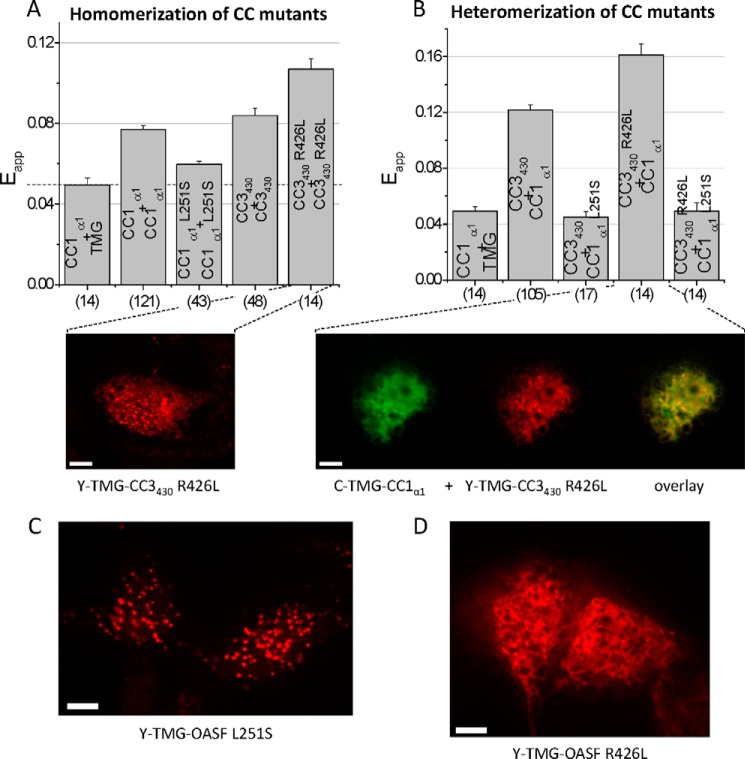
FIGURE 7.
Release of CC1α1-CC3 interaction is required for subsequent CC3449-mediated cluster formation. Block diagrams summarizing the homomerization (A) as well as heteromerization potentials (B) of various CC or helical STIM1 fragments with individual point mutations as determined by FIRE. The dashed line in A represents the magnitude of the background signal. Fluorescence images from cells expressing (A, lower panel) Y-TMG-CC3430 R426L revealed cluster formation whereas cells co-expressing (B, lower panel) C-TMG-CC1α1 + Y-TMG-CC3430 R426L led to ER localization without cluster formation. C, representative fluorescence images from cell expressing Y-TMG-OASF L251S exhibited clear cluster formation while (D) Y-TMG-OASF R426L showed ER localization without clusters. Calibration bar is 5 μm throughout.

