
FIGURE 2.
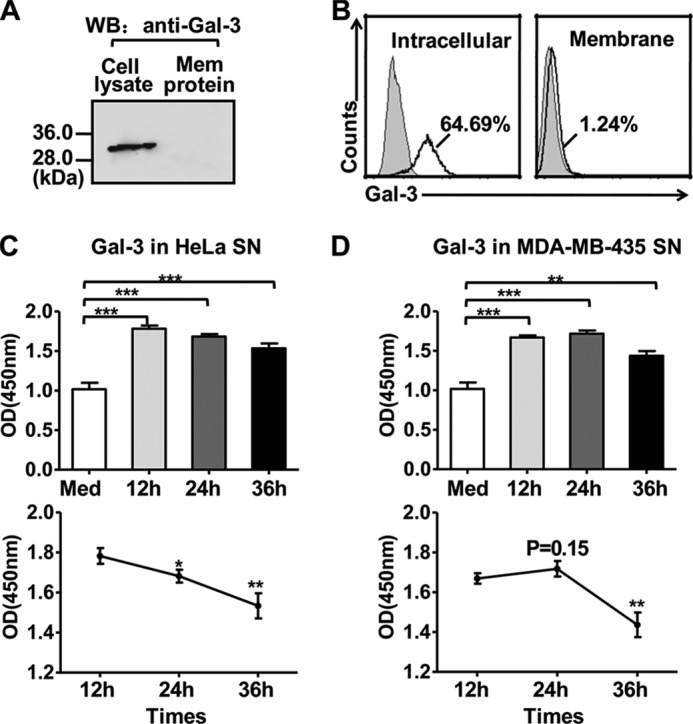
Gal-3 distribution in tumor cells. A and B, Gal-3 distribution (intracellular, surface) in HeLa cells was examined by immunoprecipitation (A) or flow cytometry (B). A, HeLa cells were biotinylated to label the cell surface proteins, and the biotinylated membrane proteins were then precipitated using streptavidin-coated agarose beads. Gal-3 from the cell lysate (left lane) or the membrane protein fraction (right lane) was detected using immunoblot analysis with an antibody against Gal-3. WB, Western blot. B, HeLa cells were treated with permeabilization buffer (left panel) or without (right panel), followed by incubation with an anti-Gal-3 mAb, and stained with a fluorescence-conjugated polyclonal antibody. C and D, Gal-3 is released from tumor cells. ELISA plates were coated with 100 μl of culture supernatants (SN) collected from HeLa (C) or MDA-MB-435 (D) cells 12, 24, or 36 h after cells were recovered in fresh medium. Control medium served as a negative control. Gal-3 was detected using an anti-Gal-3 mAb and stained with anti-mouse HRP-linked secondary antibody. The data represent the absorbance at 450 nm after normalization to the background (nonspecific binding of the antibody to the plate). The data are representative of two independent experiments and were analyzed using Student's t test. *, p < 0.05; **, p < 0.01; ***, p < 0.0001.