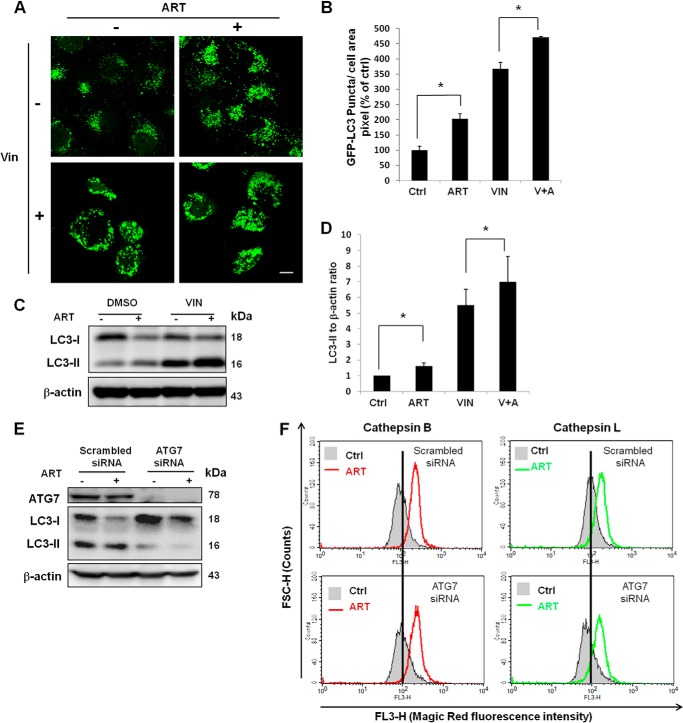
FIGURE 5.
ART induces autophagy. A, HeLa cells with stable expression of GFP-LC3 were treated with 50 μm ART or combined with vinblastine (VIN; 1 μm) for 16 h. Autophagosomes were inferred by the presence of GFP-LC3 puncta under confocal microscopy. Scale bar, 10 μm. B, stable GFP-LC3 HeLa cells were treated as in A, fluorescence images were taken using confocal microscope, and the area of GFP-LC3 puncta was quantified using ImageJ. Data (mean ± S.D. (error bars)) are representative of three independent experiments (*, p < 0.05, Student's t test). C, HeLa cells were treated as in A, and Western blot was then performed for the detection of LC3-II abundance. D, the band density of LC3-II protein was quantified using ImageQuant TL (GE Healthcare). Data (mean ± S.D.) are representative of three independent experiments (*, p < 0.05, Student's t test). E, HeLa cells were transfected with ATG7 siRNA or scrambled siRNA for 48 h. F, after 48 h of siRNA transfection, HeLa cells were treated with ART for 24 h, followed by cathepsin B and L enzymatic activities determined using Magic Red staining coupled with flow cytometry.

