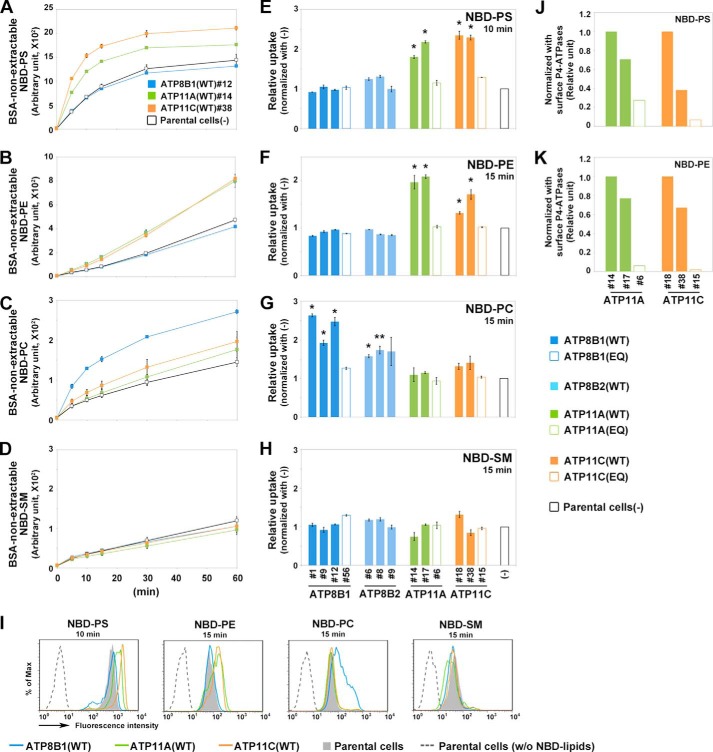
FIGURE 4.
Flippase activities of P4-ATPases across the leaflets of the plasma membrane in HeLa cells. A–D, parental HeLa cells (−; open squares) and a cell line stably expressing ATP8B1 (clone 12; blue), ATP11A (clone 14; green), or ATP11C (clone 38; orange) were incubated with the indicated NBD-lipids at 15 °C for the indicated times (x axis). After extraction with fatty acid-free BSA, the residual fluorescence intensity associated with the cells was determined by flow cytometry. Graphs are representatives of two independent experiments, and results display averages from triplicates ±S.D. E–H, each of the clonal cell lines shown in Fig. 2 was incubated with the indicated NBD-lipids at 15 °C for 15 min (or 10 min for NBD-PS). After extraction with fatty acid-free BSA, the residual fluorescence intensity associated with the cells was determined by flow cytometry. -Fold increase of NBD-lipid uptake compared with parental HeLa cells (−) is shown. Graphs are representative of at least two independent experiments, and results display averages from triplicates ±S.D. (*, p < 0.001; **, p < 0.005). Error bars represent S.D. I, a histogram of a representative experiment displaying the differences in the fluorescence intensity among parental HeLa cells in the absence (w/o NBD-lipids; dashed line) or presence (gray area) of NBD-lipids or a cell line stably expressing ATP8B1 (clone 12; blue), ATP11A (clone 14; green), or ATP11C (clone 38; orange) in the presence of indicated NBD-lipids at 15 °C for the indicated times. J and K, the enzymatic activities of WTs and glutamate mutants were normalized with the level of biotinylated P4-ATPases shown in Fig. 3D.

