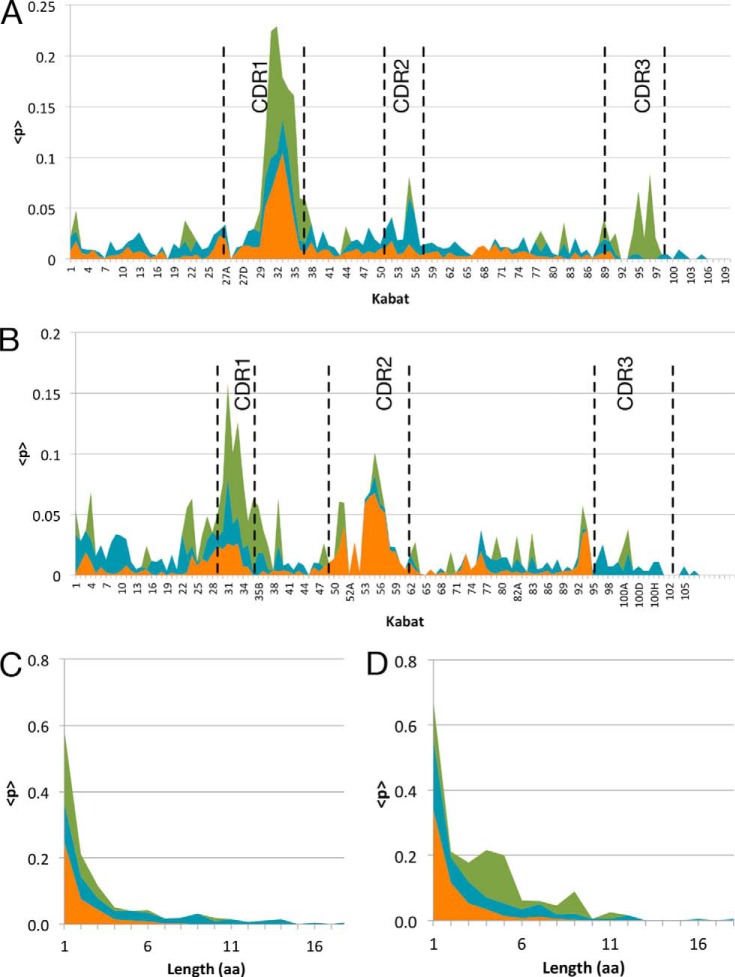
FIGURE 2.
Indel localization and length distribution in variable regions. Indel localization and length distribution in variable regions of antibodies subjected to in vitro AID without selection for improved antigen binding (blue), in vitro AID with selection for improved antigen binding (green), and in vivo antibodies obtained from immature and mature B cells (orange). Indel frequency for each Kabat position is shown in the LC (A) and in the HC (B). The frequency of observed amino acid lengths of deletions (C) and insertions (D) is shown, with same colors as above.

