
FIGURE 2.
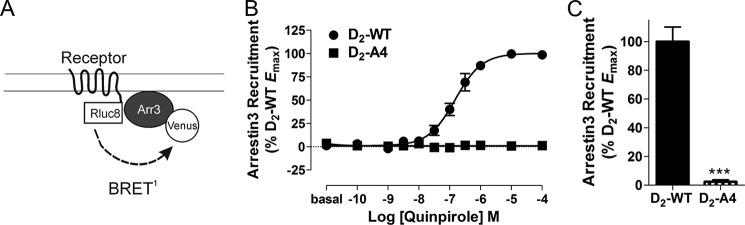
D2-A4-mediated arrestin3 recruitment. A, schematic of the BRET biosensor used to measure recruitment of arrestin to receptor. B, D2-WT-Rluc8- and D2-A4-Rluc8-mediated mVenus-Arr3 recruitment in response to incubation with quinpirole at the indicated concentrations for 10 min before measuring receptor/arrestin3 BRET. Values are expressed as the mean ± S.E. (error bars) of four independent experiments. C, maximal mVenus-Arr3 recruitment by D2-A4-Rluc8 in response to quinpirole stimulation, expressed as a percentage of the activation by D2-WT. Because a curve could not be fit to the data for D2-A4, the BRET response in the presence of 100 μm quinpirole was used as the maximal response. ***, p < 0.001 compared with D2-WT, Student's t test. Receptor density and the basal BRET for D2-WT-Rluc8 were 569 ± 111 fmol/mg protein and 0.03 ± 0.005, and for D2-A4 Rluc8, they were 722 ± 209 fmol/mg protein and 0.05 ± 0.016, respectively.