FIGURE 3.
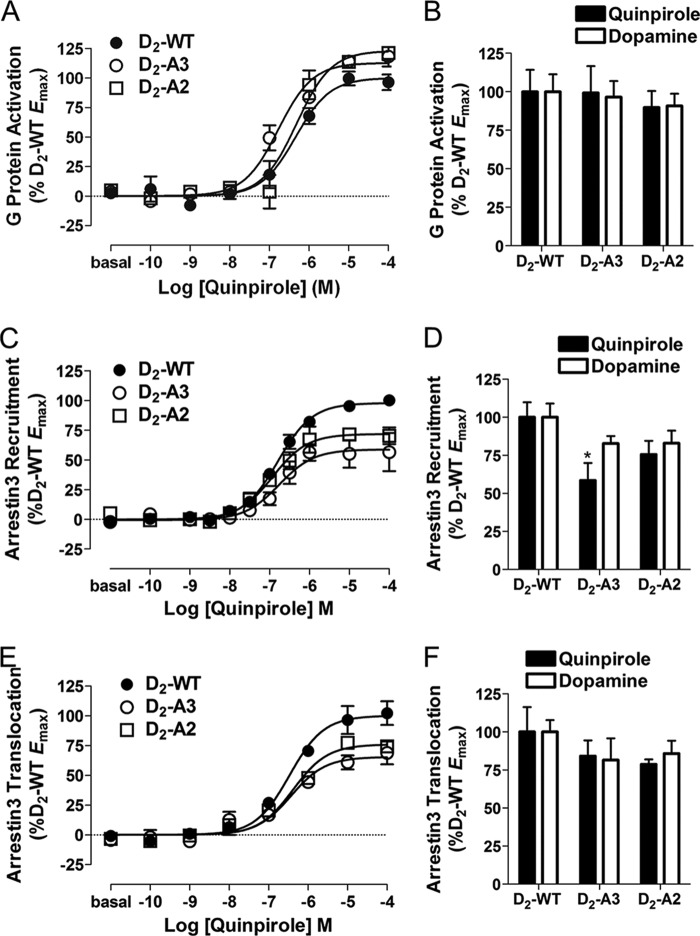
D2-WT-, D2-A3-, and D2-A2-mediated G protein activation and arrestin3 recruitment. A, D2-WT-, D2-A3-, and D2-A2-mediated G protein activation was assessed in HEK293T cells co-transfected with Gαi1-Rluc8, V1-Gβ1, V2-Gγ2, and receptor and then incubated with quinpirole at the indicated concentrations for 2 min before measuring the G protein BRET response. Dose-response curves are representative of three independent experiments performed with triplicate samples (mean ± S.E. (error bars)). B, maximal G protein activation by D2-A3 and D2-A2 in response to quinpirole or dopamine stimulation, determined from the concentration response curves and expressed as a percentage of the response to D2-WT. G protein activation by the mutants was not significantly different from that by WT as determined by Tukey's multiple comparison test. D2-A3 and D2-A2 were expressed at 100 ± 5 and 78 ± 7% of the wild type receptor, respectively. C, D2-WT-, D2-A3-, and D2-A2-mediated arrestin3 recruitment in HEK293 cells transfected with the indicated receptor fused to Rluc8 and mVenus-Arr3 and incubated with agonist at the indicated concentrations for 10 min. Values are expressed as the mean ± S.E. of seven (D2-WT) or four (D2-A3 and D2-A2) independent experiments. D, maximal mVenus-Arr3 recruitment by D2-A3 and D2-A2 in response to quinpirole or dopamine stimulation, determined from the individual concentration-response curves and expressed as a percentage of the maximal response to D2-WT. *, p < 0.05 compared with D2-WT within the same treatment group, Tukey's multiple comparison test. Receptor density and basal BRET for D2-WT-Rluc8 were 1290 ± 151 fmol/mg protein and 0.07 ± 0.007; for D2-A3-Rluc8, they were 1223 ± 160 fmol/mg protein and 0.14 ± 0.006; and for D2-A2-Rluc8, they were 1300 ± 60 fmol/mg protein and 0.10 ± 0.008. E, D2-WT-, D2-A3-, and D2-A2-mediated arrestin3 translocation to the membrane in HEK293 cells transfected with the indicated receptor, GRK2, Rluc8-arrestin3-Sp1, and mem-linker-citrine-SH3 and incubated with agonist at the indicated concentrations for 10 min. Dose-response curves are representative of three independent experiments performed with triplicate samples (mean ± S.E.). F, maximal Rluc8-arrestin3-SP1 membrane translocation in response to quinpirole or dopamine stimulation of untagged D2-WT, D2-A3, or D2-A2 receptors. Basal BRET was 0.64 ± 0.020 for D2-WT, 0.64 ± 0.017 for D2-A3, and 0.63 ± 0.023 for D2-A2.

