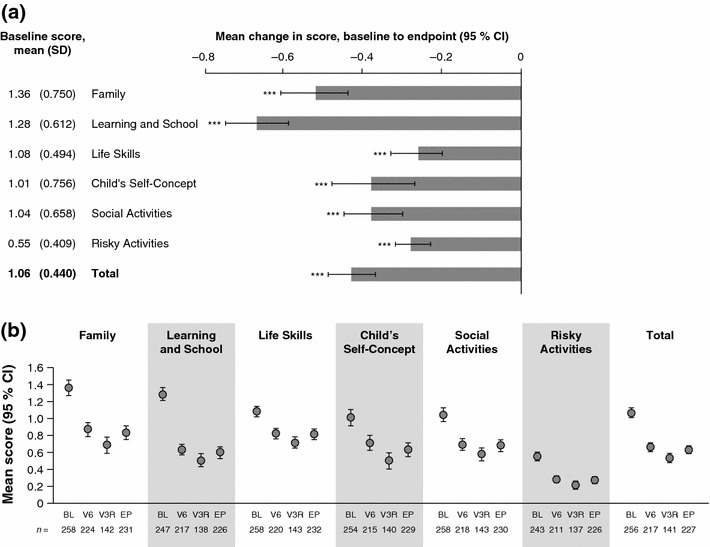
Fig. 4.

WFIRS-P scores during the open-label period (n = 262). a Mean scores at open-label baseline and histogram showing mean change from open-label baseline to endpoint for WFIRS-P domain and total scores. Error bars show 95 % confidence intervals. Negative changes indicate reduced functional impairment. ***p < 0.001, **p < 0.01, change at endpoint versus baseline (two-sided t test). P values are nominal and were not adjusted for multiple comparisons. b Mean WFIRS-P domain and total scores at baseline (BL), endpoint (EP), visit 6 (V6 8 weeks) and visit 3R (V3R ≥26 weeks) of the open-label period. Error bars show 95 % CIs. These data were not subjected to statistical testing. Numbers of observations (n) are shown for each data point. Higher scores indicate more severe functional impairment. BL baseline, CI confidence interval, EP endpoint, R revised, SD standard deviation, V visit, WFIRS-P Weiss Functional Impairment Rating Scale-Parent Report
