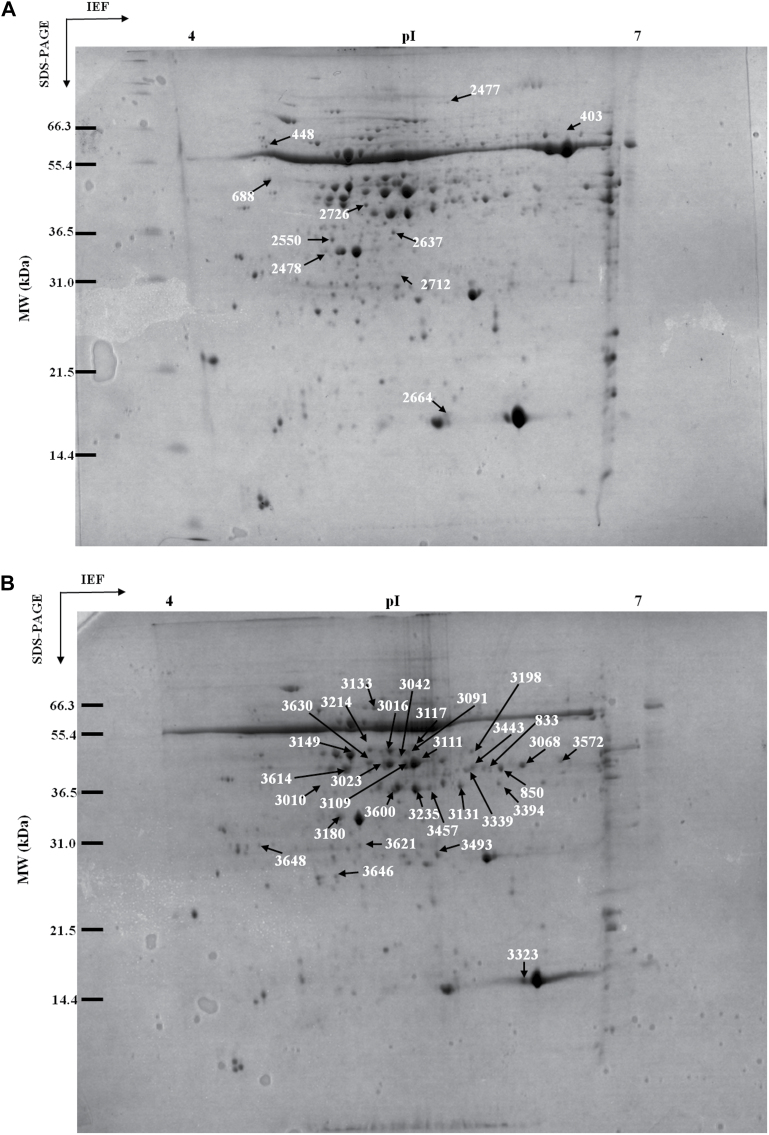
Fig. 6.
Representative two-dimensional electrophoresis gels of wheat leaf proteins during drought priming and drought stress. (A) Representative gel resulting from Progenesis Samespot software comparing the non-primed plants, stem elongation stage-primed plants, and twice-primed plants. (B) Representative gel resulting from Progenesis Samespot software comparing control plants, non-primed plants under drought stress, stem elongation-primed plants under drought stress, and twice-primed plants under drought stress. Differentially expressed protein spots in the drought priming treatments and drought stress treatments are indicated by arrows and listed in Tables 1 and 2. M r, relative molecular mass; pI, isoelectric point.

