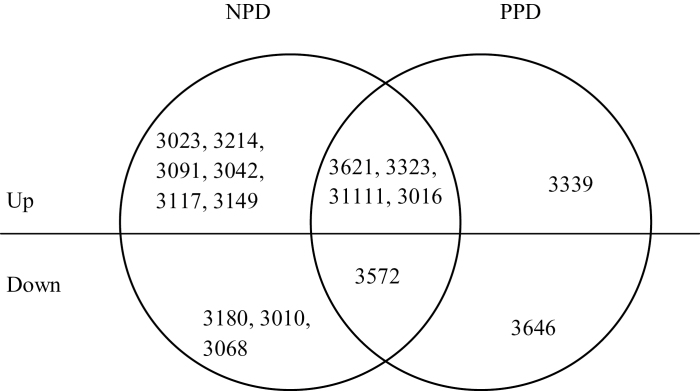
Fig. 9.
Venn diagrams of changed protein spots in primed plants (NPD and PPD) compared with non-primed plants (NND) under drought stress during grain filling. See Fig. 1 legend for abbreviations. The numbers indicate differently expressed protein spots.

