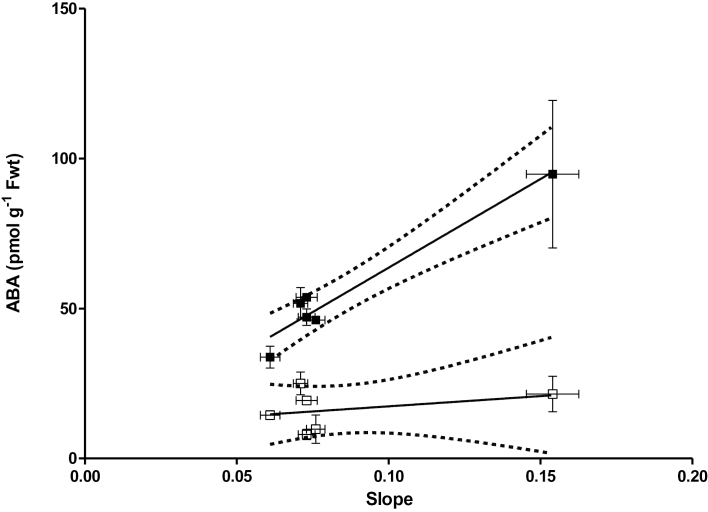
Fig. 10.
Relationship between desiccation response (slope of the E×RWC relationship) and the ABA-concentration before (open symbols) and after (closed symbols) 45min desiccation of the leaves in Col-0, Cvi-0, and Map-42 accessions. The dashed line is 95% confidence interval. R2 of the goodness of the fit is 0.94 for closed symbols and 0.12 for open symbols.

