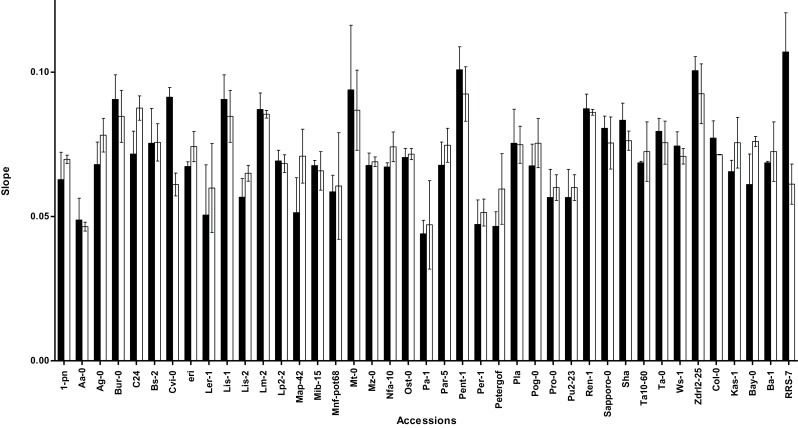
Fig. 6.
Slopes of the curves for relationship between transpiration rate (E) and leaf relative water content during 10 000 s desiccation of the leaves of plants that had been exposed for 4 d to moderate (1.17 kPa; filled bars) or to low (0.23 kPa; open bars) VPD. The leaves were first saturated in degassed deionized water and after 1h measurements were conducted during desiccation at VPD of 1.40 kPa.

