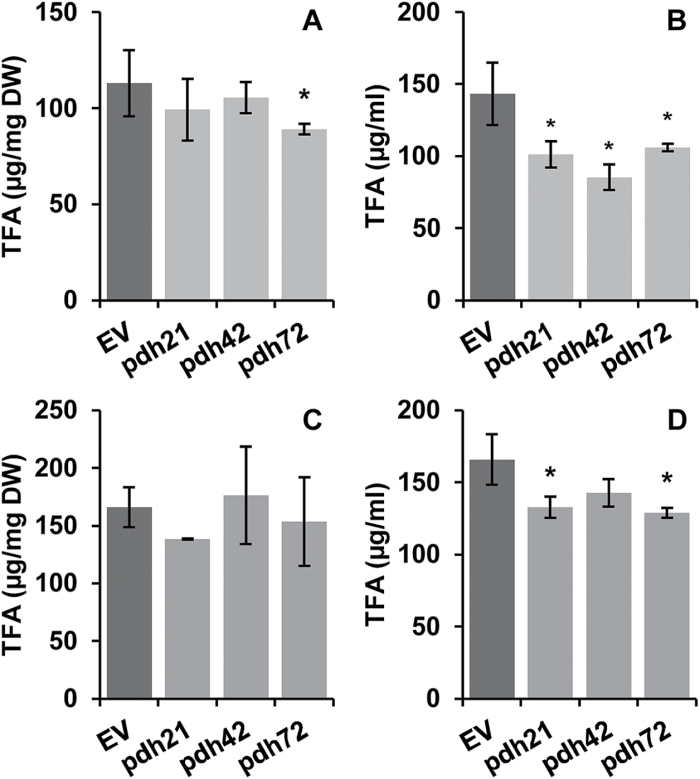
Fig. 3.
Effect of PDC2_E1α silencing on C. reinhardtii after 6 d of cultivation in HSM (A, B) and in TAP (C, D) medium. (A, C) TFA content of biomass. (B, D) Culture TFA content. Bars for the pdh lines represent means±SD of two biological and two technical replicates (n=4). EV values are means of two individual lines (n=8). Asterisks indicate significant differences between the EV and the pdh lines at P<0.05 (Student’s t-test).

