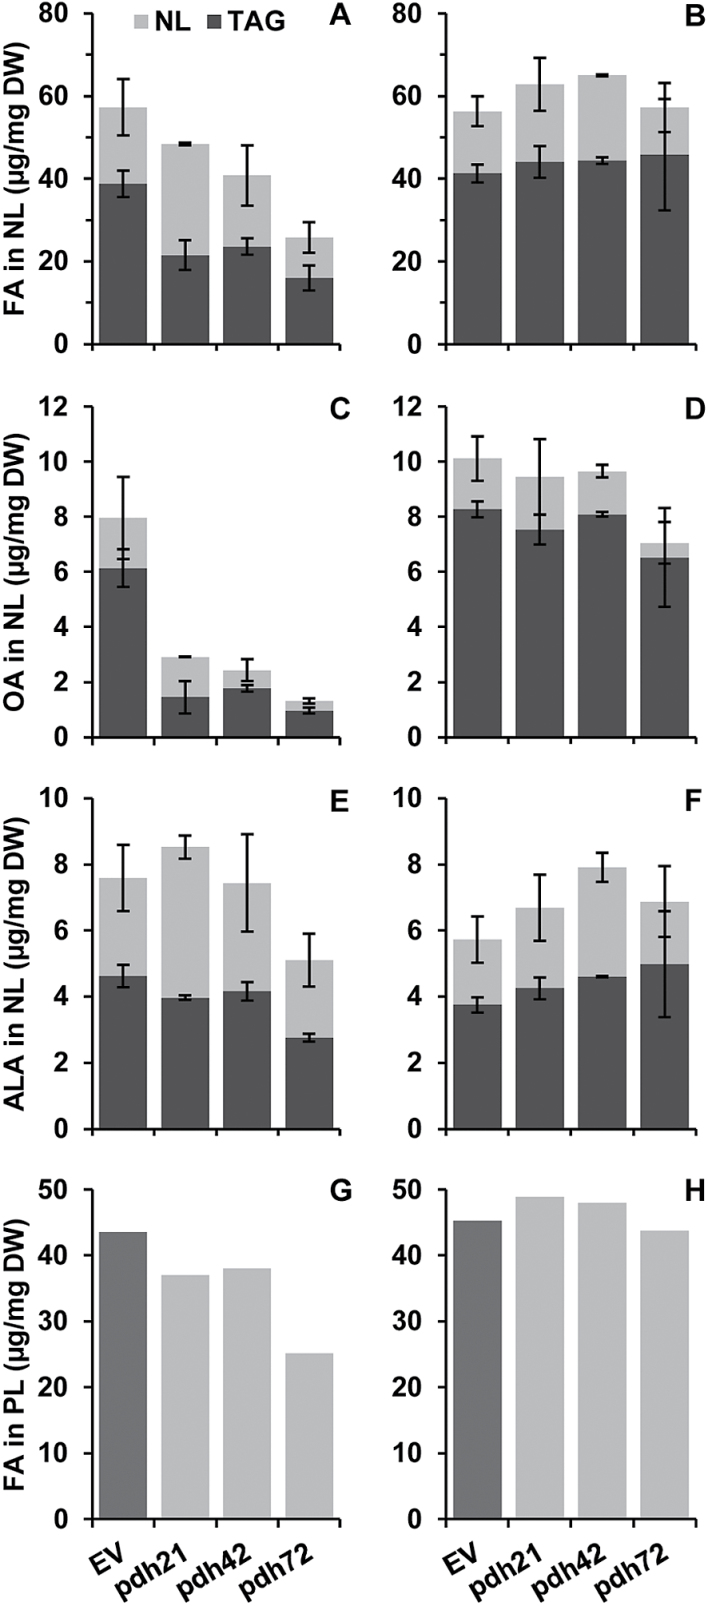
Fig. 6.
Effect of PDC2_E1α silencing on FA distribution in NLs, TAG (A–F), and in PLs (G, H) of C. reinhardtii after 2 d of nitrogen starvation in HSM-N (A, C, E, G) and in TAP-N (B, D, F, H) medium. The contribution of TAG total FA, OA, and ALA to NLs is shown in dark grey (A)–(F). Values shown (except for PL in G and H) are the means±SD of two technical replicates from pooled samples of three biological replicates. Analysis of FA content in PL was performed from the pooled samples with two replicates. EV bars represent means of two individual lines.

