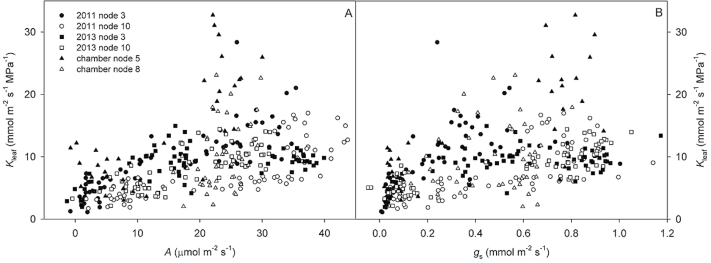
Fig. 3.
K leaf and A (A) and K leaf and g s (B) for all leaves measured across the growing season. A and g s were measured at midday, and maximum K leaf was measured for the exact same leaves sampled before sunrise the next morning. Measurements at all leaf ages are included for the experiment/node combinations shown. Regressions were calculated separately for each experiment/node, and the correlation statistics for K leaf/A and K leaf/g s relationships at each node are listed in Table 1.

