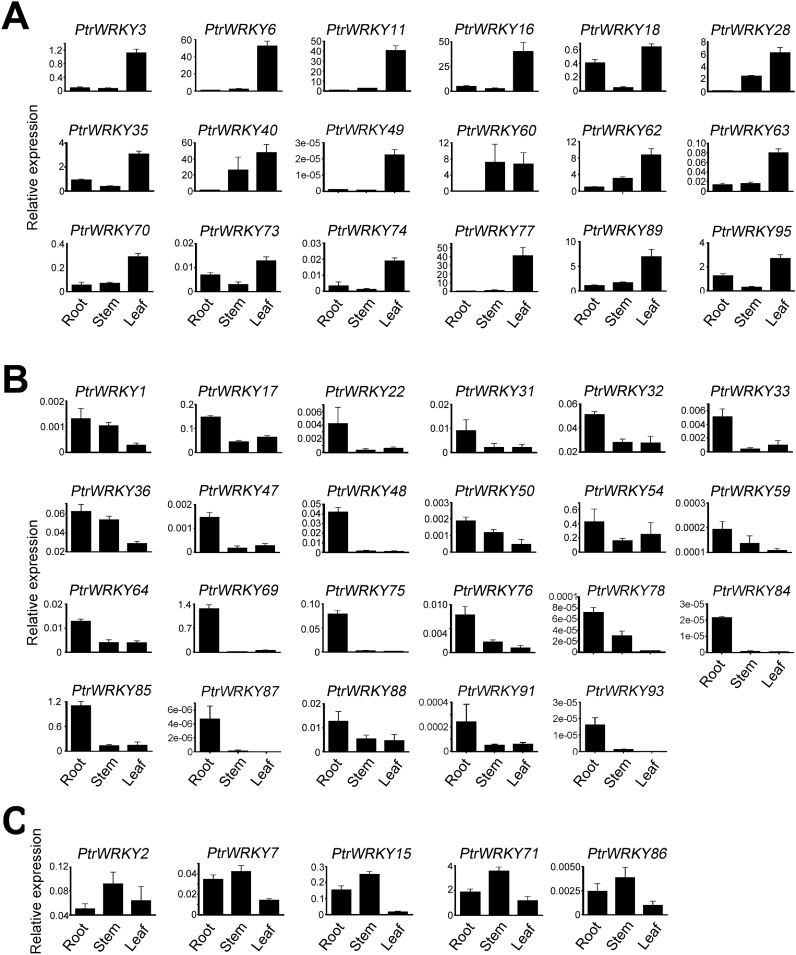
Fig. 4.
Expression analysis of 46 PtrWRKY genes using qRT-PCR. Relative quantities of PtrWRKY members in root, stem, and leaf are illustrated. (A–C) The members have highest expression levels in leaves, stems, and roots, respectively. Error bars result from three biological replicates. Poplar 18S expression was used as a control and gene-specific primers were used for qRT-PCR analysis of Populus WRKY genes.

