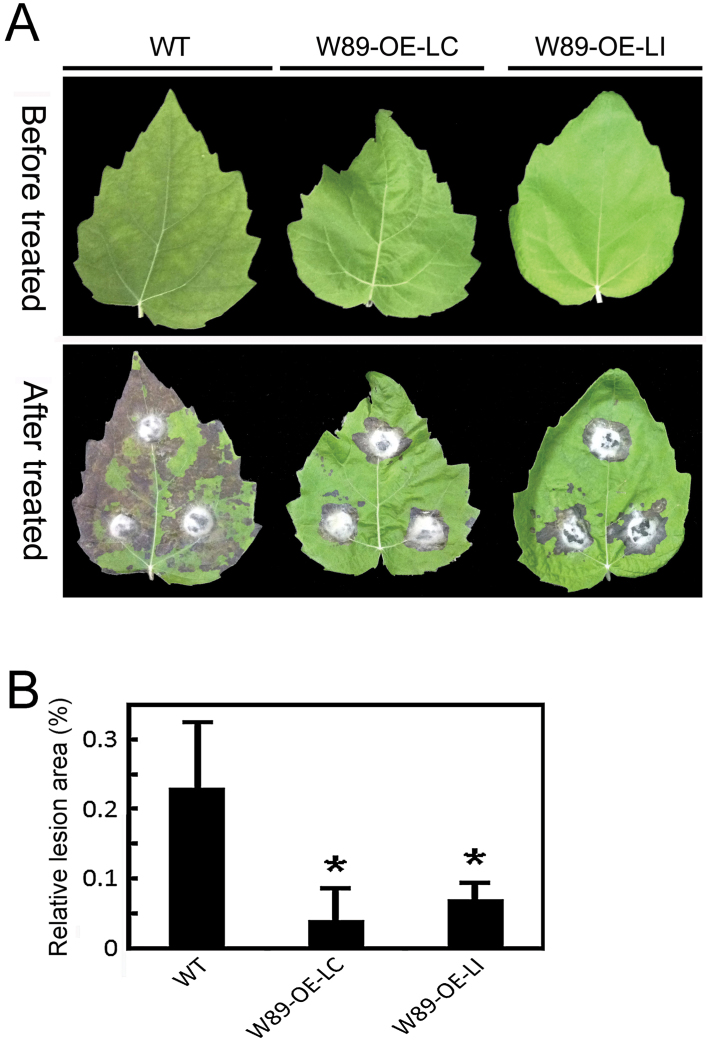
Fig. 8.
Resistance of transgenic poplar plants inoculated with D. gregaria. (A) The leaves from wild-type and transgenic plants before treatment and after infection with D. gregaria 3 d after inoculation were photographed. (B) Mean infected area of transgenic lines to the fungal pathogen; PtrWRKY89 confers resistance to D. gregaria in transgenic poplar plants. Values are means of three replications. Error bars indicate standard deviations. Asterisks indicate a statistically significant difference between wild-type and transgenic plants (P < 0.05 by student’s t-test). This figure is available in colour at JXB online.

