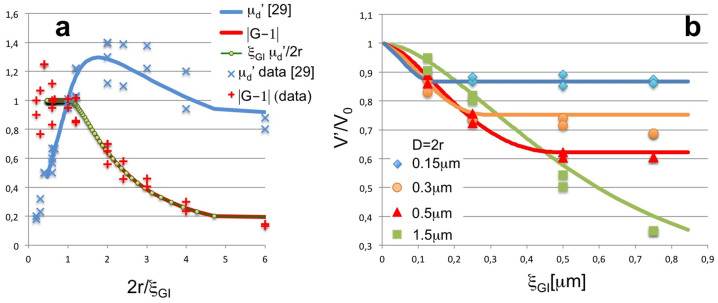
Figure 3.
Data versus theory (a) Representation of measured data μd' and calculation as provided in Ref. 27 (blue line and symbols); Data and theory transformed according to ξGI μd'/2r (red crosses and green line with circles, respectively) and |(G-1)| as calculated for the samples from the theory presented here (red line) displaying full agreement proving that the calculation presented and data reduction in Ref. 27 corresponds to 2r|(G-1)|/ξGI; (b) Visibility data (markers) from (a) Ref. 27 and calculation (lines) presented according to equ. (18) as a function of autocorrelation length ξGI and sorted by sample (particle size), demonstrating good agreement between theory and data as well as the direct relation to particle size and scattering cross section (note: here represented by 2r only), both of which can be extracted straightforwardly. (Note: no error bars are given as original data in Ref. 27 is provided without error bars and any additional introduced error is considered less than the given symbol sizes).

