
Fig. 1.
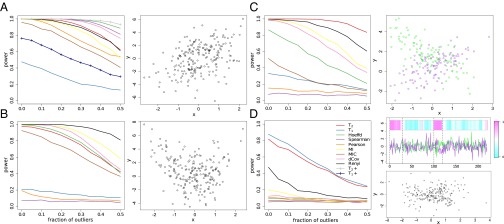
The power of various statistics rejecting at 5% significance level as level of contamination by outliers increases when the bivariate data follow (A) a linear relationship, (B) a quadratic relationship, (C) a cross-shaped relationship, and (D) two partially coupled time series. The heat map in D shows the absolute values of the Pearson correlations calculated at each time point including its neighboring 15 points.