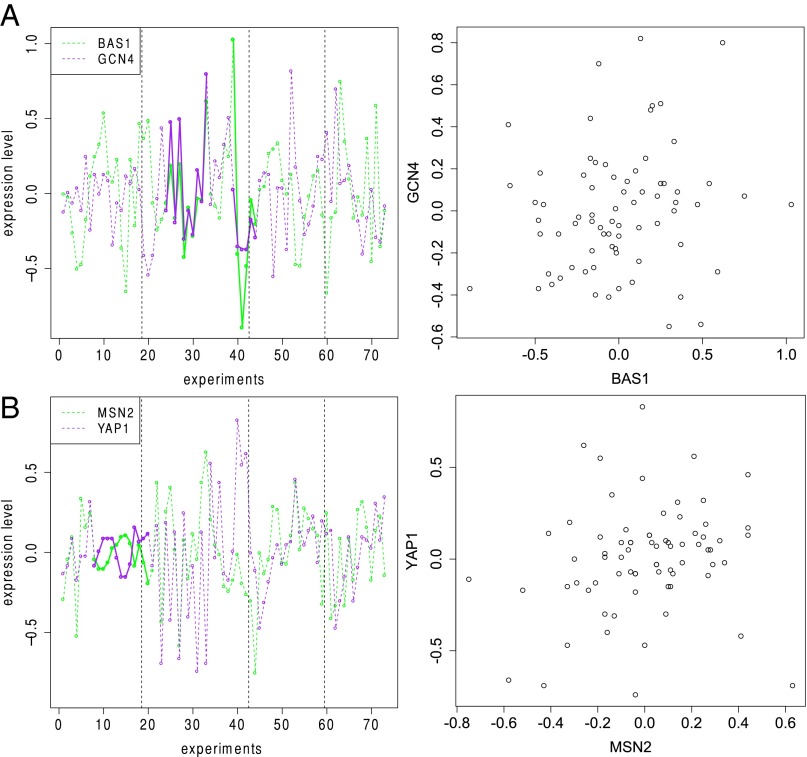
Fig. 2.
Expression levels of (A) BAS1 and GCN4 and (B) MSN2 and YAP1 in four time-course experiments (boundaries indicated by the dashed lines). The darker solid lines highlight regions contributing to the counts in . Both pairs of genes have reported genetic interactions. Their coexpression strengths were consistently ranked among the top 10 and top 20 by with k = 7 but were assigned very low rankings by all of the other methods.

