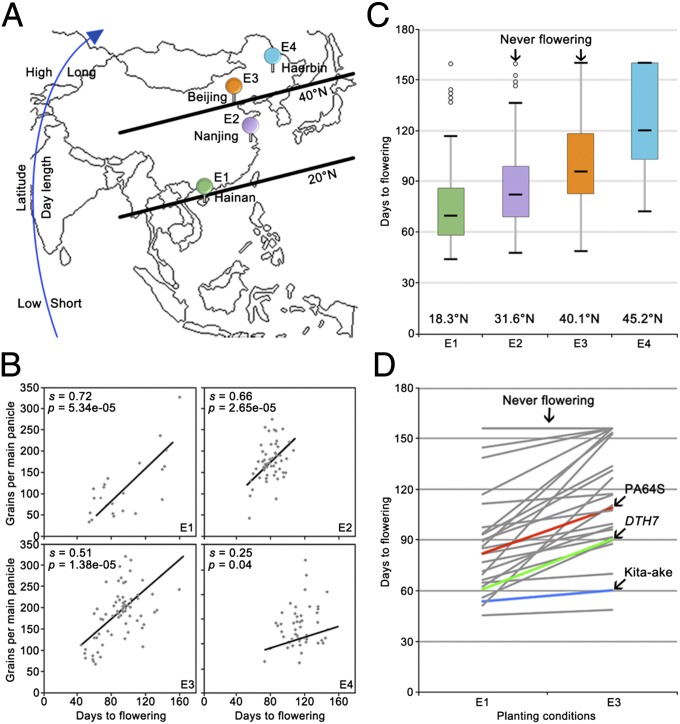
Fig. 1.
Association between grain yield and flowering time in rice. (A) Geographic locations of four planting stations: E1, Hainan (18°30’N, 110°2’E); E2, Nanjing (31°56’N, 119°4’E); E3, Beijing (40°13’N, 116°13’E); and E4, Haerbin (45°20’N, 127°17’E). (B) Flowering time of 91 accessions in the core collections under E1, E2, E3, and E4 conditions. The standardized coefficient was represented by s. Student's t tests were used to generate the p values. (C) Grains per main panicle is associated with flowering time. Grains per main panicle of a partial set of accessions were record under E1 to E4 conditions. (D) Flowering time of a partial set of the core collection accessions under natural SDs (E1) and LDs (E3). Flowering time and grains per main panicle of 91 accessions were recorded under E1, E2, E3, and E4 conditions. Flowering time and grains per main panicle of each accession are presented as means ± standard deviations (n = 20).

