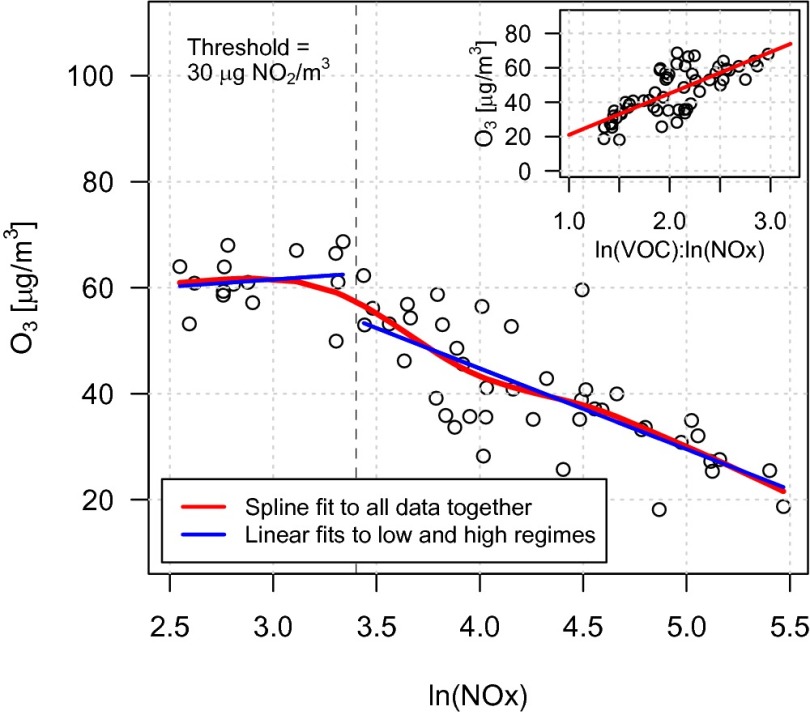
Fig. 2.
Relationship between yearly mean ozone and precursor concentrations at European monitoring stations observing ozone, NOx, and NMVOCs. Main plot shows the existence of low- and high-NOx regimes (with opposite-signed relationships). (Inset) The relationship between ozone and the NMVOC:NOx ratio. These data were used to guide choice of functional form in our model. Data from AirBase v.6 (65).

