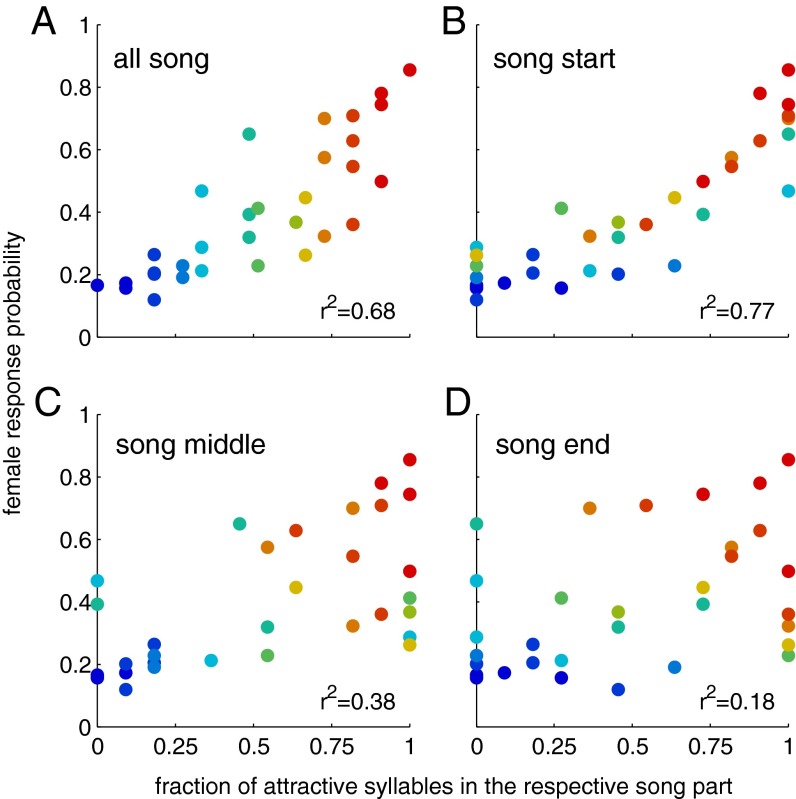
Fig. 2.
Dependence of behavior on the structure of song sequences. Dependence of female response probability on the fraction of attractive and nonattractive syllables for (A) the entire song, (B) the song start (syllables 1–11), (C) the middle of song (syllables 12–22), and (D) song end (syllables 23–33; Fig. 1C). The color code corresponds to fraction of attractive syllables in the full song ranging from 1.0 (red) to 0.0 (blue). Shown is the average response probability based on n = 27 animals.

