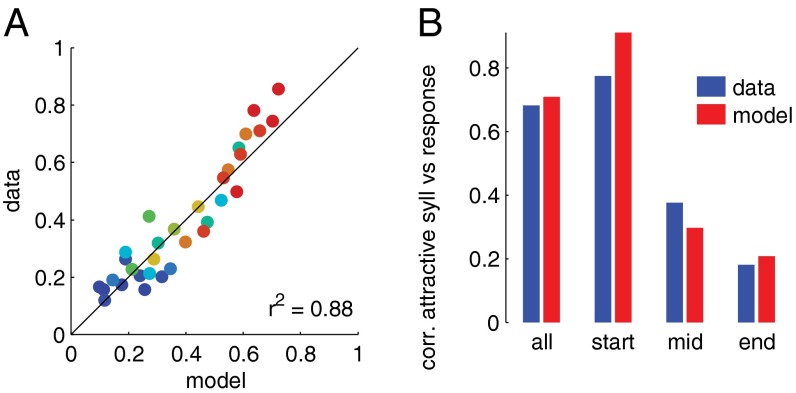
Fig. 3.
A drift-diffusion model predicts behavioral choices. (A) Predictions of a drift-diffusion model and actual behavior. The color code corresponds to fraction of attractive syllables in the full song ranging from 1.0 (red) to 0.0 (blue). (B) Correlation (r2) between measured/predicted responses and the fraction of attractive syllables in different parts of the song [data, blue (Fig. 2); model, red].

