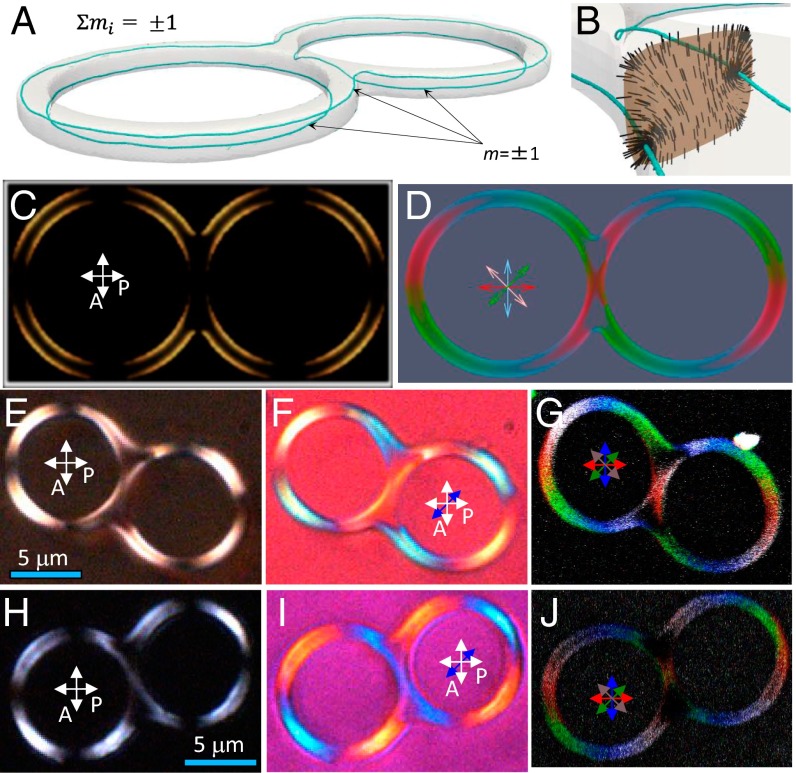
Fig. 3.
(A) g = 2 drop with defect rings depicted using blue isosurfaces of and corresponding (B) cross-section of n(r) and (C) POM texture. (D) The 3PEF-PM texture obtained by superimposing simulated images acquired at four different linear polarizations of excitation light marked by red, blue, green, and pink double arrows; (E–J) Experimental micrographs obtained using POM between crossed polarizer P and analyzer A without (E and H) and with an additional 530-nm phase retardation plate (F and I) and using 3PEF-PM (G and J). Experimental 3PEF-PM texture was obtained by superimposing images with polarizations of probing light at (red), (green), (blue), and (pink), corresponding to the simulated texture shown in D; note the dark areas in junctions, where n(r) is perpendicular to the images.

