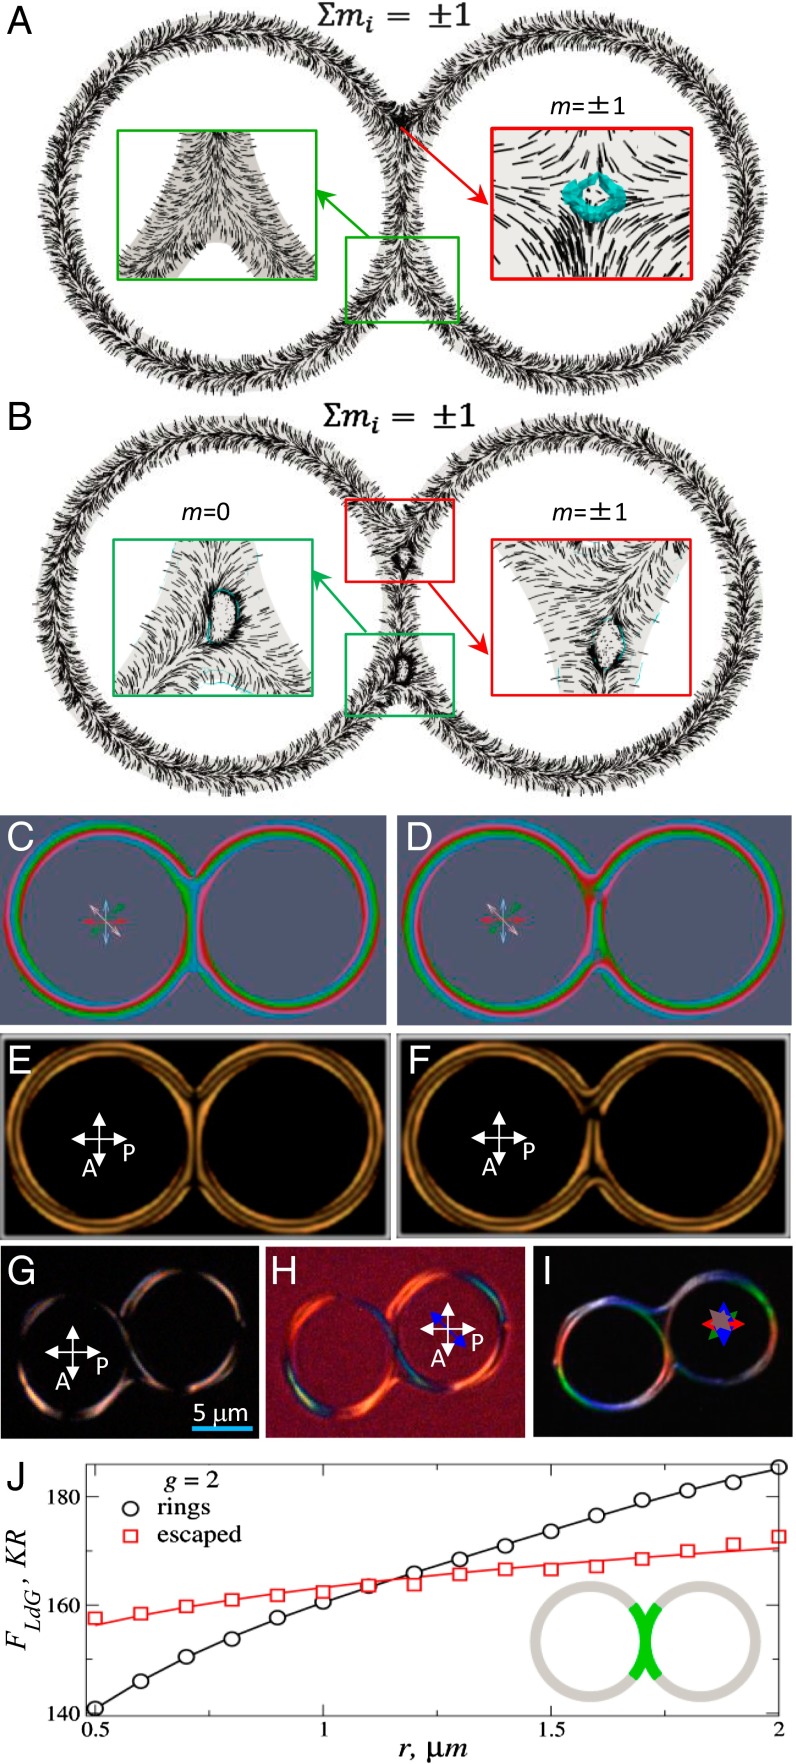
Fig. 4.
(A and B) Escaped n(r) structures depicted in the drop’s midplane for . (Insets) Junction regions and blue tubes depict isosurfaces of . Hyperbolic hedgehog defect core and disclination loops with zero (green-framed) and unit (red-framed) topological charges. (C and D) Corresponding 3PEF-PM textures obtained by superimposing simulated images at four different linear polarizations of excitation light marked by red, blue, green, and pink double arrows. (E and F) corresponding POM images between crossed polarizer P and analyzer A. (G and H) Experimental POM textures obtained (G) without and (H) with an inserted phase retardation plate having a slow axis along the blue double arrow. (I) Experimental 3PEF-PM texture obtained by superimposing images with polarizations of probing light at (red), (green), (blue), and (pink). (J) Landau–de Gennes free energy, Eq. 1, as a function at for configuration with disclination rings (circles) and solitonic escape (squares) as shown in A. The green region of the droplet (Inset) marks the 3D minimization domain. In the gray region, the minimization is done by exploiting the symmetry of the confinement region and then the tensor is fixed (see Materials and Methods for more details).

