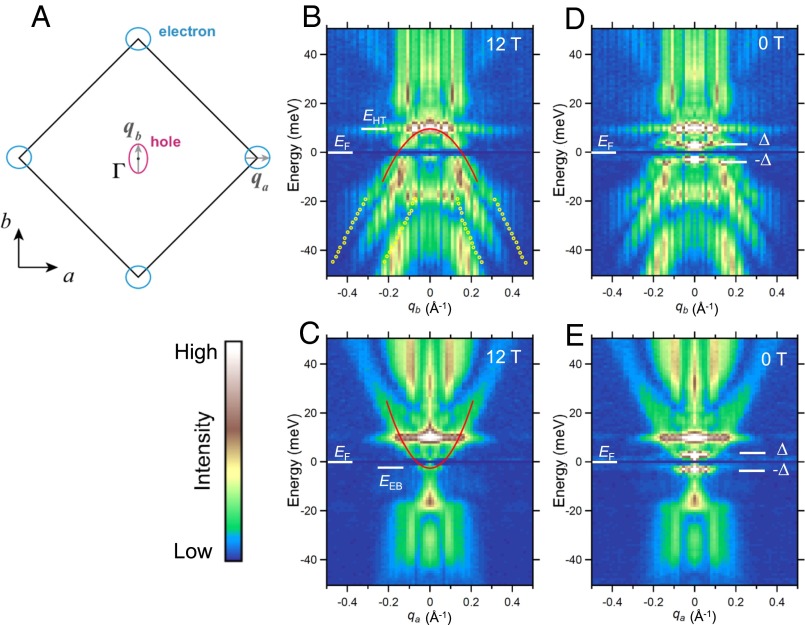
Fig. 2.
Band dispersions obtained from the QPI pattern. (A) Schematic figure of the Fermi surface of FeSe inferred from QPI. (B and C) QPI dispersions at 12 T obtained by taking linecuts from the energy-dependent Fourier-transformed normalized conductance images (SI Text, section 4 and Fig. S5) along and , respectively. A q-independent feature at ∼+10 meV is associated with defect states (SI Text, section 4 and Fig. S6). Peak positions of the representative branches are fitted with parabolic function to obtain Fermi energies and effective masses (solid lines). The top (bottom) of the hole (electron) band () is indicated by white bars. Expected intraband scattering vectors associated with the α-band detected by ARPES (22) are plotted in B by yellow circles. (D and E) QPI dispersions at . A pair of sharp intensity peaks () appears at meV due to the opening of the superconducting gap. Superconducting gap defined by the positions of the coherence peaks (white bars) are comparable to the Fermi energies. Note that the feature attributed to defect states is independent of field.

