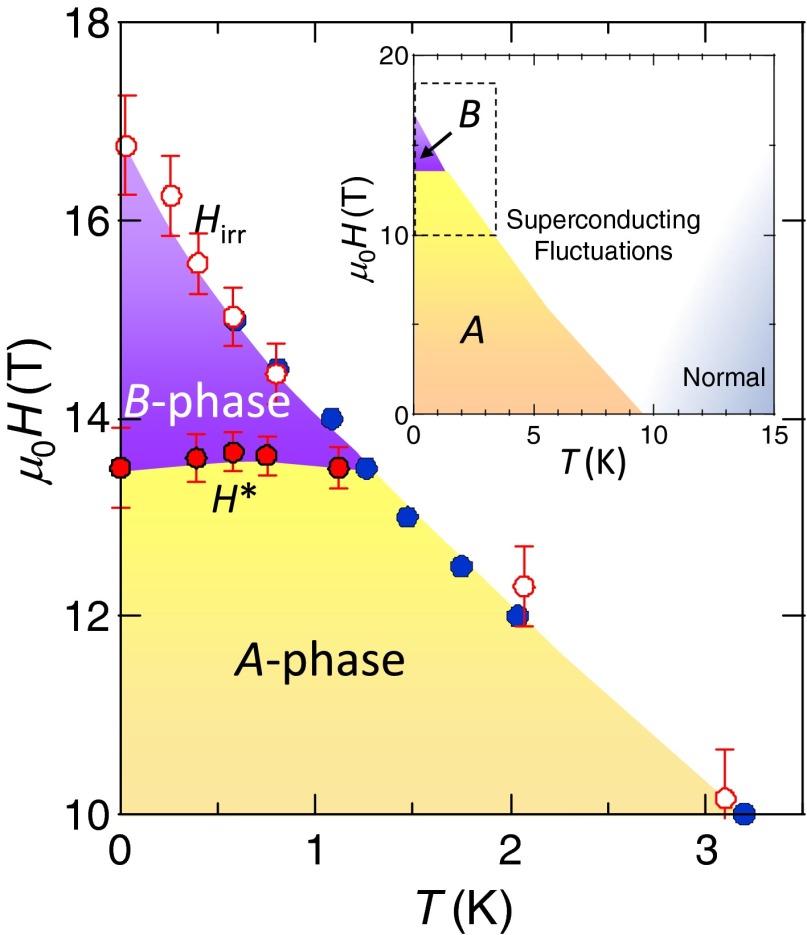
Fig. 4.
H-T phase diagram of FeSe for . Solid blue and open red circles represent determined by zero resistivity and the onset of hysteresis loops of the magnetic torque, respectively. The mean-field upper critical field is above . Solid red circles represent determined by the cusp of shown in Fig. 3 B and C, separating a high-field superconducting phase (B phase) from the low-field phase (A phase). (Inset) Overall H-T phase diagram. Superconducting fluctuation regime is determined by the temperature at which the resistivity deviates from the behavior expected in conventional semimetallic systems.

