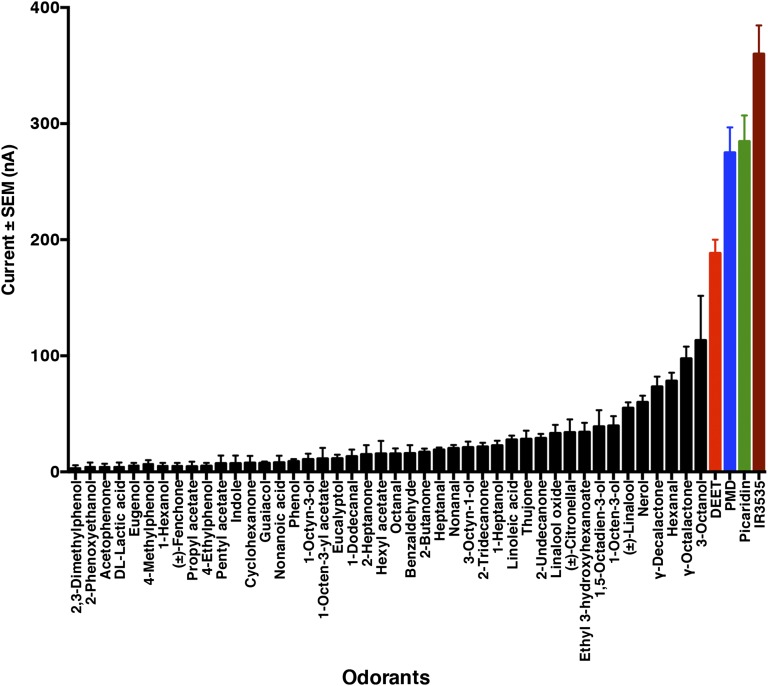
Fig. 3.
Quantification of current responses of CquiOR136•CquiOrco-expressing oocytes. Two hundred compounds were tested at a source dose of 1 mM. For clarity, compounds that did not elicit detectable currents were omitted, and responding compounds were displayed in increasing order of responses. n = 4, mean ± SEM.

