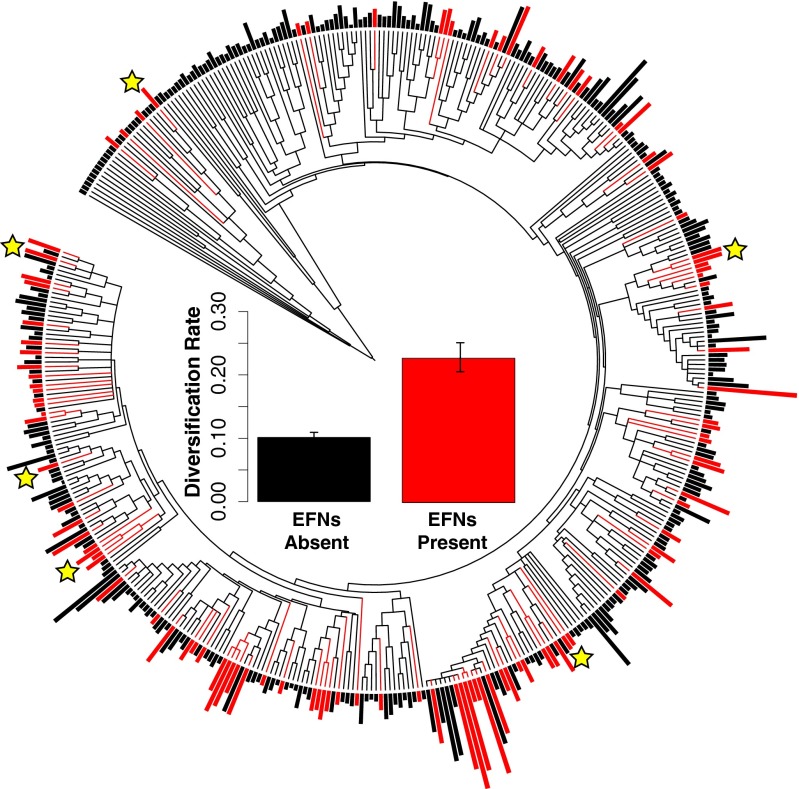
Fig. 2.
Phylogeny of vascular plant families (APGIII) (19), with families containing species with EFNs colored red. Outer bars correspond to the age-standardized number of species [i.e., (log number of species)/(age of plant family in millions of years)]. Yellow stars mark the families of the six clades analyzed subsequently in this study. (Inset) Mean diversification rate (r) ± SE of families with and without species with EFNs calculated according to the method of Magallon and Sanderson (41) assuming no extinction. See Tables S1 and S2 for F and P statistics and calculations with additional extinction fractions for both megatrees.

