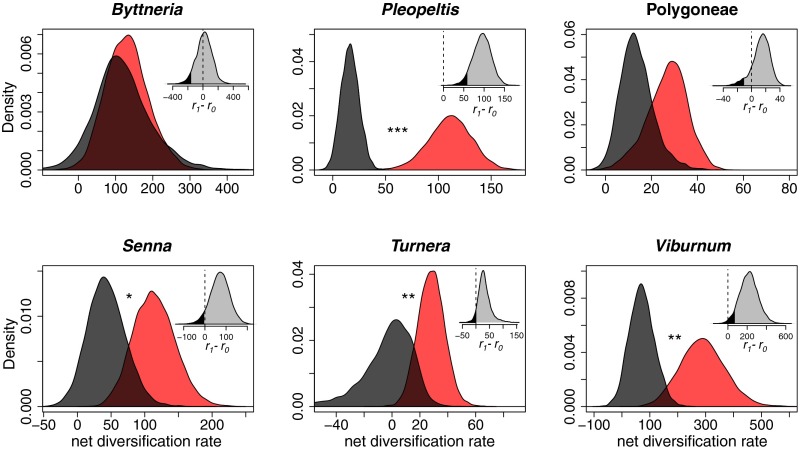
Fig. 3.
Marginal distribution of net diversification rate (speciation − extinction) parameters in EFN-present (red) and EFN-absent (black) clades from an analysis using the Bayesian implementation of BiSSE (29, 30) on MCC trees with median node heights from BEAST analyses for each lineage. *P < 0.1; **P < 0.05; ***P < 0.001. (Insets) Histograms represent the joint marginal distribution of the difference between EFN and non-EFN diversification rates, with the >0.05% probability quantile shaded dark gray and a dotted line at zero.

