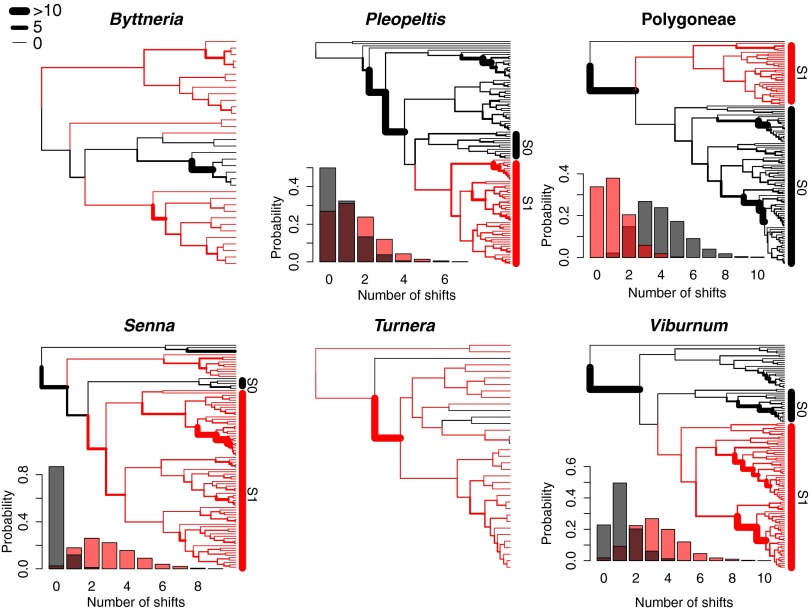
Fig. 4.
Diversification rate shifts in the EFN and non-EFN clades of six plant clades. For each group, the MCC tree is shown with branches that subtend nodes with a high marginal probability of EFNs in red and branches that subtend nodes with a high marginal probability of non-EFN in black. Branch widths are scaled to Bayes factors, representing confidence that a rate shift occurred on that branch. Bars to the right of phylogenies display the EFN (S1) and non-EFN (S0) sister clades used in sister-clade comparisons. (Insets) Histograms display the posterior distribution of the number of rate shifts in the EFN clade (red) and the sister non-EFN clade (gray).

