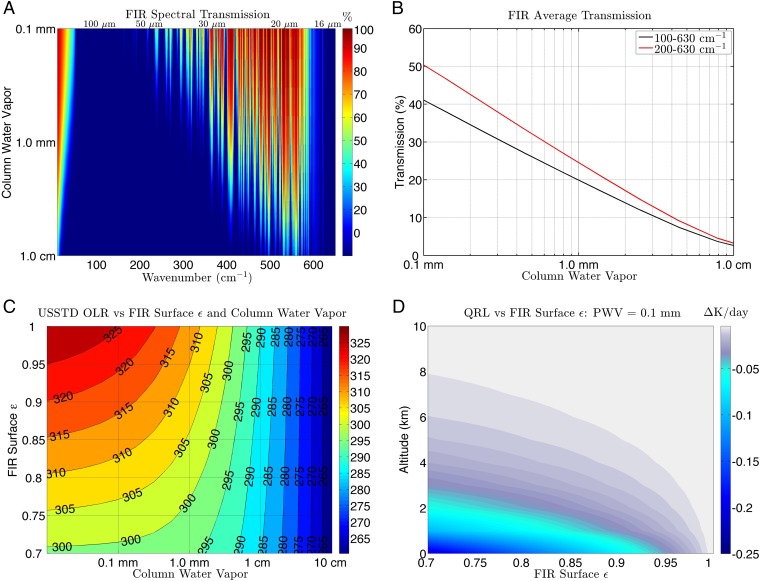
Fig. 1.
(A) Spectral transmission at 1 cm−1 intervals as a function of wavelength for U.S. Standard Atmosphere (40) and PWV, as calculated with LBLRTM. (B) Average transmission between 100 cm−1 and 650 cm−1 as a function of precipitable water vapor for the U.S. Standard Atmosphere. (C) Contour plot of the relationship between OLR and the average surface emissivity at wavelengths between 15.9 μm and 100 μm and precipitable water vapor for the U.S. Standard Atmosphere, as calculated with RRTMG (32). (D) Difference in cooling rate profiles (QRL) between the U.S. Standard Atmosphere with a water-vapor profile scaled to 0.1 mm and a far-IR surface emissivity of 1.0 and that same atmosphere with a far-IR surface emissivity noted on the abscissa.

