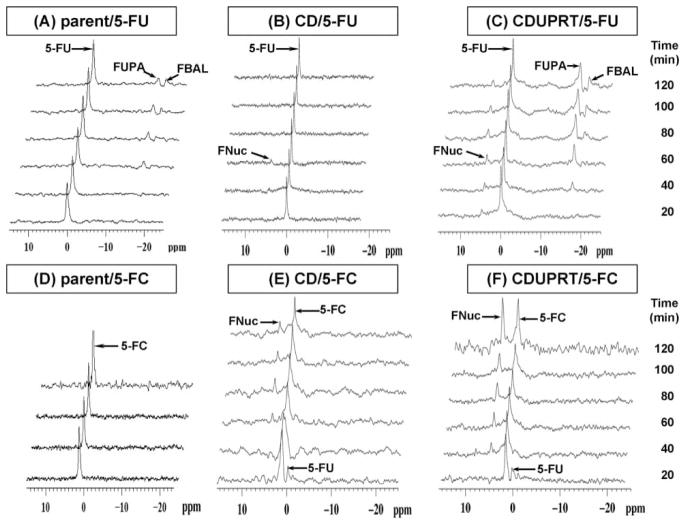
Figure 3.
Representative, 1D 19F MR spectra of the whole tumor, demonstrating the uptake and metabolism of 5-FU (upper panel) and 5-FC (lower panel) in R3227-AT parental tumors (A, D), R3327-CD/mDsRed tumors (B, E), and R3327-CD/UPRT/mDsRed tumors (C, F). Each MR spectrum was averaged over 600 acquisitions (acquisition time 10 min/spectrum). The start of the acquisition coincided with the i.v. injection of 150 mg/kg 5-FC or 5-FU via a tail vein catheter. The chemical shift of 5-FU is normalized to 0 ppm with 5-FC at 1 ppm and FNuc at 4.8–5 ppm. Signal assigned are: 5-FU, 5-fluorouracil; 5-FC, 5-fluorocytosine; FNuc, fluoronucleotides; FUPA, α-fluoroureidopropionic acid; FBAL, α-fluoro-β-alanine.

