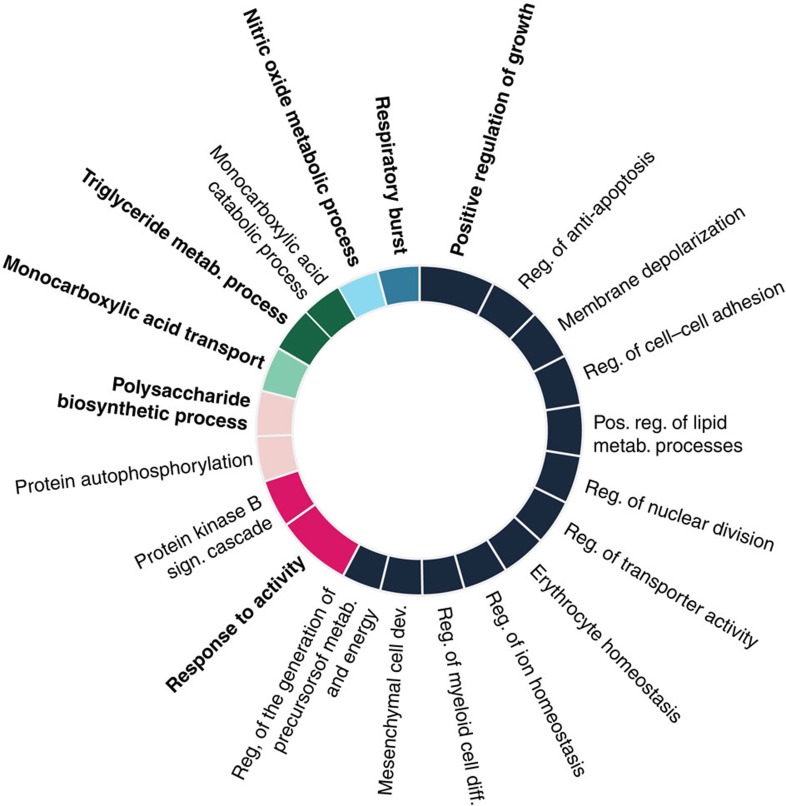
Figure 5. Revigo analysis of the significant pathways.
A sunburst graph of the non-redundant clustered FDR significant GO terms associated with prenatal famine exposure. The size of the circular boxes are proportional to the level of statistical evidence. In bold are the dominant terms of the clusters, which are denoted in different colours.

