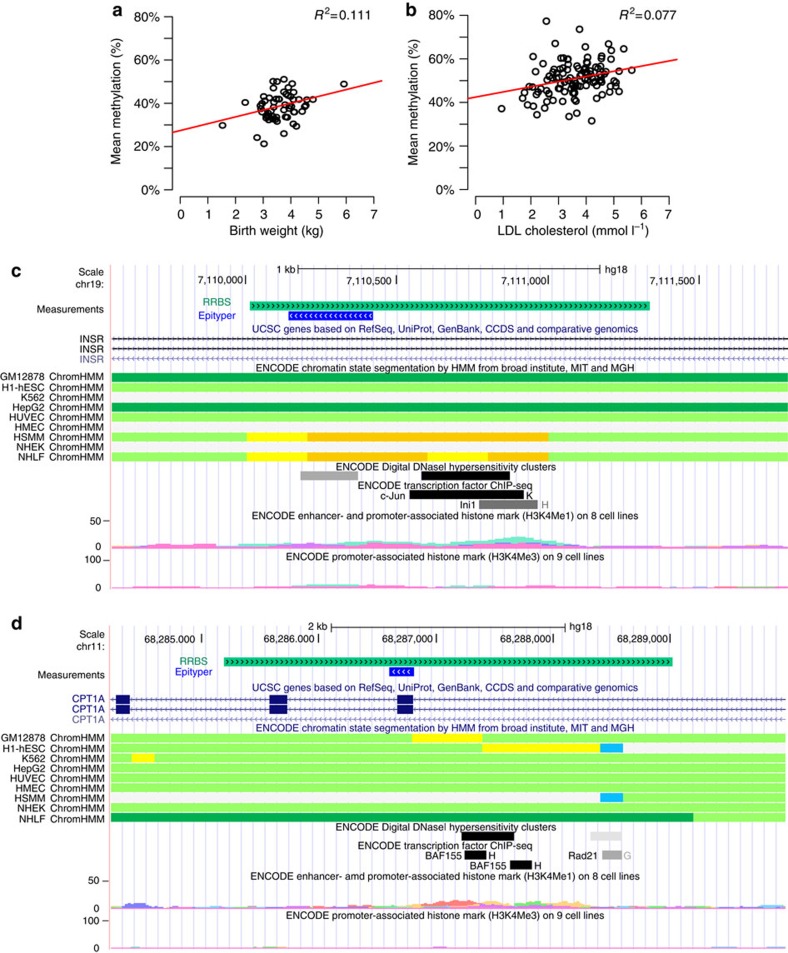
Figure 6. The INSR and CPT1A P-DMRs.
(a) Scatterplot between birth weight (x axis) and the average DNA methylation of the INSR P-DMR (y axis) in the 60 prenatally exposed individuals. (b) Scatterplot between LDL (x axis) and the average DNA methylation of the CPT1A P-DMR (y axis) in all 120 siblings. (c) Genomic annotation of INSR DMR. The P-DMR overlaps an enhancer in the HSMM and NHLF cell lines and an DNaseI hypersensitivy cluster in over 30 cell lines. (d) Genomic annotation of CPT1A DMR. The P-DMR overlaps an enhancer in the blood derived GM12878 and embryonic stem cell line H1 and a DNaseI hypersensitive cluster in over 30 cell lines. Furthermore, the BAF155 transcription factor binds in this region.

