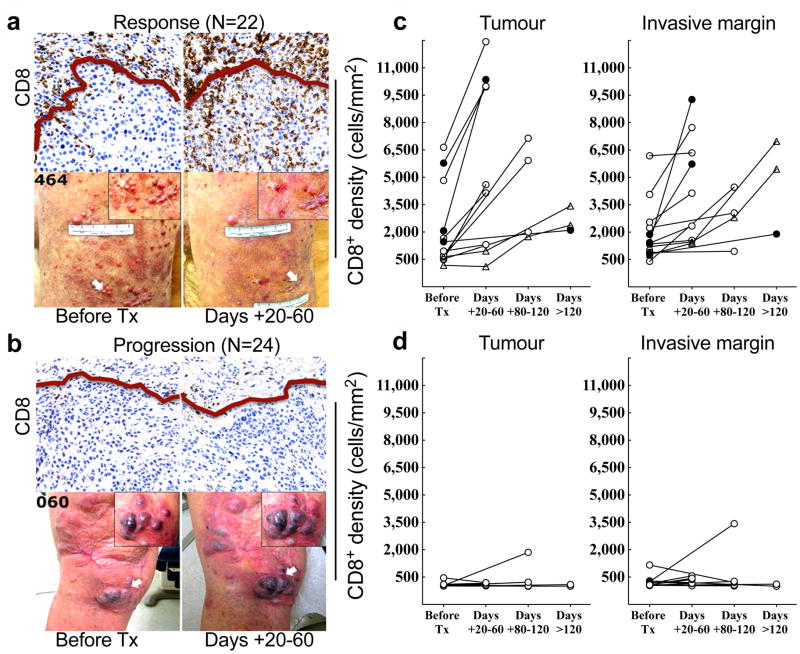
Figure 1. Immunohistochemical analysis of CD8+ T cells in samples obtained before and during pembrolizumab treatment.
a and b, Examples of CD8 expression in melanoma tumours serially biopsied before PD-1 blocking treatment (Tx) and 20–60 days after treatment began (Days + 20–60) from a patient in the Response (a) and Progression (b) groups. Red line separates tumour parenchyma (below line) and invasive margin (above line). Magnification, X20. c and d, CD8+ cell density at the tumour center and invasive margin in samples from all Responders (c, n = 13) and Progressors (d, n = 12) who received a biopsy before and during treatment.● =complete response, ○ =partial response, △ = delayed response.

