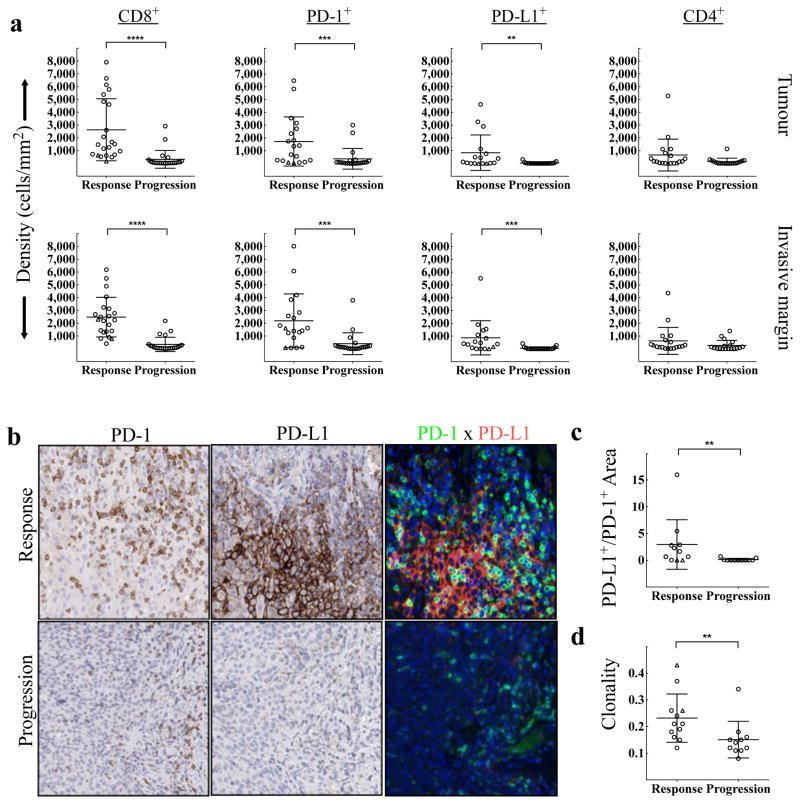
Figure 3. Baseline density, location, and proximity of CD8+, PD-1+, PD-L1+, and CD4+ cells, and T cell repertoire according to treatment outcome.
a, Melanoma samples collected before treatment with PD-1 blocking therapy were assessed for CD8 (Response n=22, Progression n=24), PD-1 (Response n=19, Progression n=21), PD-L1 (Response n=17, Progression n=21), and CD4 (Response n=19, Progression n=18) density by quantitative immunohistochemistry in the tumour compartment and at the invasive margin. **P < 0.01, ***P < 0.001, ****P < 0.0001. b, Examples of the relative proximity of PD-1 and PD-L1 expressing cells in representative baseline samples from a responder and a progressor. c, Proximity analysis of PD-1 and PD-L1 based on multiplex quantitative immunofluorescence in baseline tumour samples (Response n=11, Progression n=11). **P = 0.005. d, Results of TCR sequencing performed on 25 whole tumour samples taken at baseline (Response n=12, Progression n=11). **P = 0.004. △ = Delayed Response.

