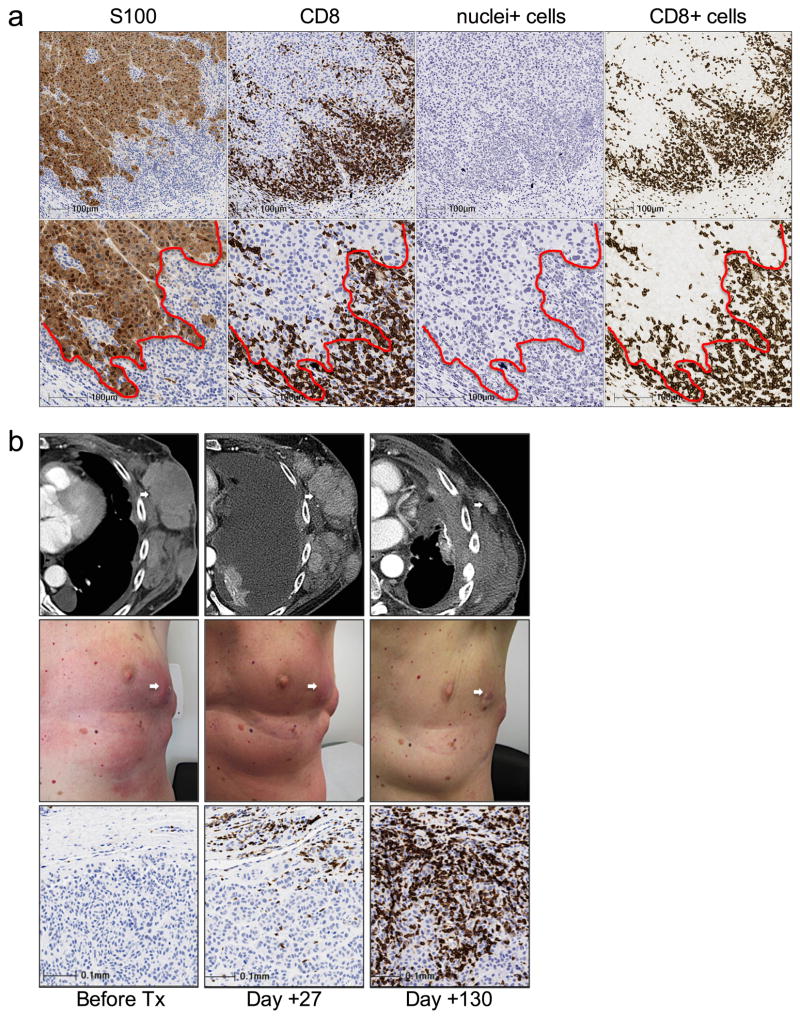
Extended Data Figure 1. CD8 cell infiltrates in tumor biopsies.
a, Segmentation of the invasive margin and tumour parenchyma using S100 and CD8 chromogenic staining. Low magnification (top row) and high magnification (bottom row) are shown. The red dotted line illustrates S100+ tumour (left of red line) and S100− stroma (right of red line). Coordinates of the invasive margin and tumour parenchyma are generated from the S100 stained image (column labeled S100) and subsequently imported into the CD8 stained image (column labeled CD8). This is followed by a deconvolution imaging algorithm of the CD8 stained image where first, all nuclei (column labeled Nuclei+) are identified and quantified, irrespective of what type of cell. This is followed by identifying CD8+ membrane (column labeled CD8+) for cell quantification and analysis. b, CD8+ T-cell kinetics within the tumour microenvironment in a serially sampled tumour responding to PD-1 blocking therapy. Example of radiographic, clinical, and CD8 IHC in a serially sampled melanoma tumour of the left chest wall that was obtained from a patient with a delayed response. On day +20, clinical and radiographic examinations indicated progressive disease; at a time when CD8 T-cells expression increased in density at the invasive margin.

