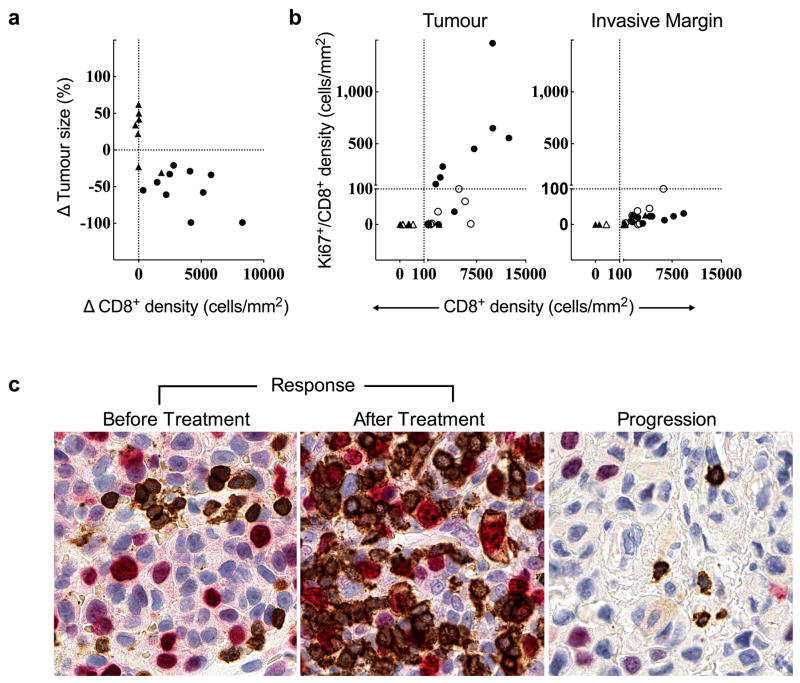
Extended Data Figure 2. Proliferation of CD8+ T cells in regressing tumours.
a, Relationship of the change in CD8+ cell density and best percent change in tumour size in serially sampled tumours that were assessed using quantitative immunohistochemistry and CT scan measurements (n=18, Spearman r = −0.75, P = 0.0002). b, CD8+ cell density and Ki67+/CD8+ cell density in the Response group before treatment (n=11, empty circles) and during treatment (n=17, filled circles) and the Progression group before treatment (n=9, empty triangles), and during treatment (n=15, filled triangles). c. Representative examples of CD8/Ki67 chromogenic double staining from a biopsy of a patient with a tumor response and another with progression. Double positive CD8 cells (red labeled Ki67 nucleus, CD8 brown labeled membrane) are not present at baseline, but are present during tumor regression in the biopsy from a patient with a tumor response. The double positive cells are not in the biopsy of a patient with progression during treatment (no Ki-67 labeling in brown CD8 cells). Magnification, X40.

