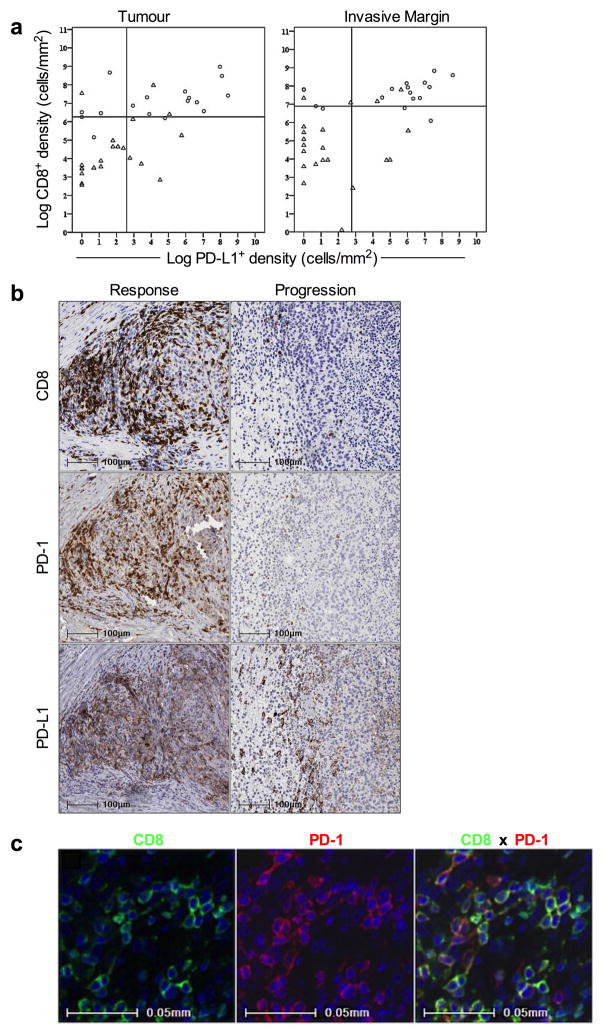
Extended Data Figure 4. Relationship between CD8 and PD-L1 expression in terms of treatment outcome.
a, Scatterplots of CD8 and PD-L1 density (cells/mm2) using a log(x+1) scale are shown in samples obtained at baseline stratified by treatment outcome. Reference “cut-points” for CD8 and PD-L1 densities were based on the median value for each marker across the entire cohort. Samples present in the CD8highPD-L1high quadrant, in both tumour and invasive margin, were predominantly derived from the Response group. Samples present in the CD8lowPD-L1low quadrants were significantly associated with the Progression group (Response n=17, Progression n=21, P < 0.001 at both the invasive margin and tumour). b, CD8, PD-1, and PD-L1 expression before treatment in terms of clinical response. Representative examples of the proximity between CD8+, PD-1+, PD-L1+ cells in the tumour microenvironment in pre-treatment samples obtained from a patient with a tumour response and progression. Magnification, X20. 2 μM serial cut tissue sections were stained for CD8, PD-1, and PD-L1. c, Multiplexed immunofluorescence staining of CD8 and PD-1 to evaluate the relative coexpression of CD8 and PD-1 on individual cells within the tumour microenvironment. CD8+ cells were were detected using AlexaFluor 488 staining in the green channel. PD-1+ cells were detected suing AlexaFluor 594 staining in the red channel. High levels of co-expression of the 2 antigens were observed when the two channels are combined, yielding yellow signal in areas of colocalization.

