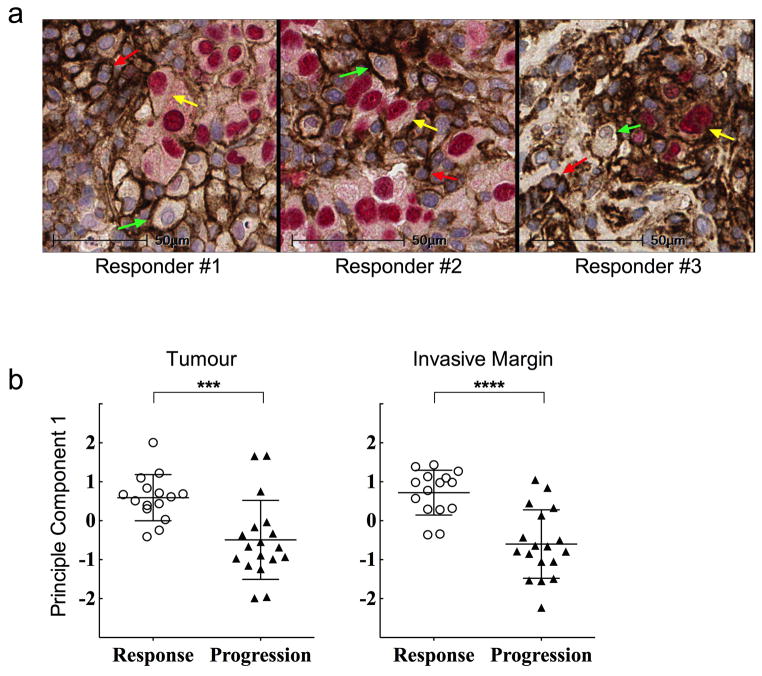
Extended Data Figure 5. PD-L1 expression and relationship with T cell infiltration.
a, Multiplexed chromogenic staining of SOX-10 (red nucleus) and PD-L1 (brown membrane) to evaluate PD-L1 expression on melanoma cells, lymphocytes, and macrophages within the tumour microenvironment. SOX-10 is a transcription factor that is melanoma cell specific. Representative high power fields of double positive cells (yellow arrows) show melanoma cells expressing PD-L1 and single positive PD-L1 cells comprising of lymphocytes (high nuclear:cytoplasmic ratio, red arrows) and macrophages (low nuclear:cytoplasmic ratio, green arrows) in three responders from samples obtained during tumour regression.. Magnification, X40. b, Principal component analysis (PCA) to decompose the variance for the markers (CD8+, PD-1+, PD-L1+, and CD4+ cell densities (cells/mm2) separately in the tumour and in the invasive margin. The first principal component accounted for the majority of the variability in the four markers 69.6% and 57.1%, in the tumour center (***P= 0.001) and the invasive margin (****P < 0.0001), respectively. Principal component scores for the first principal component were compared between response groups with Wilcoxon rank sum tests.

